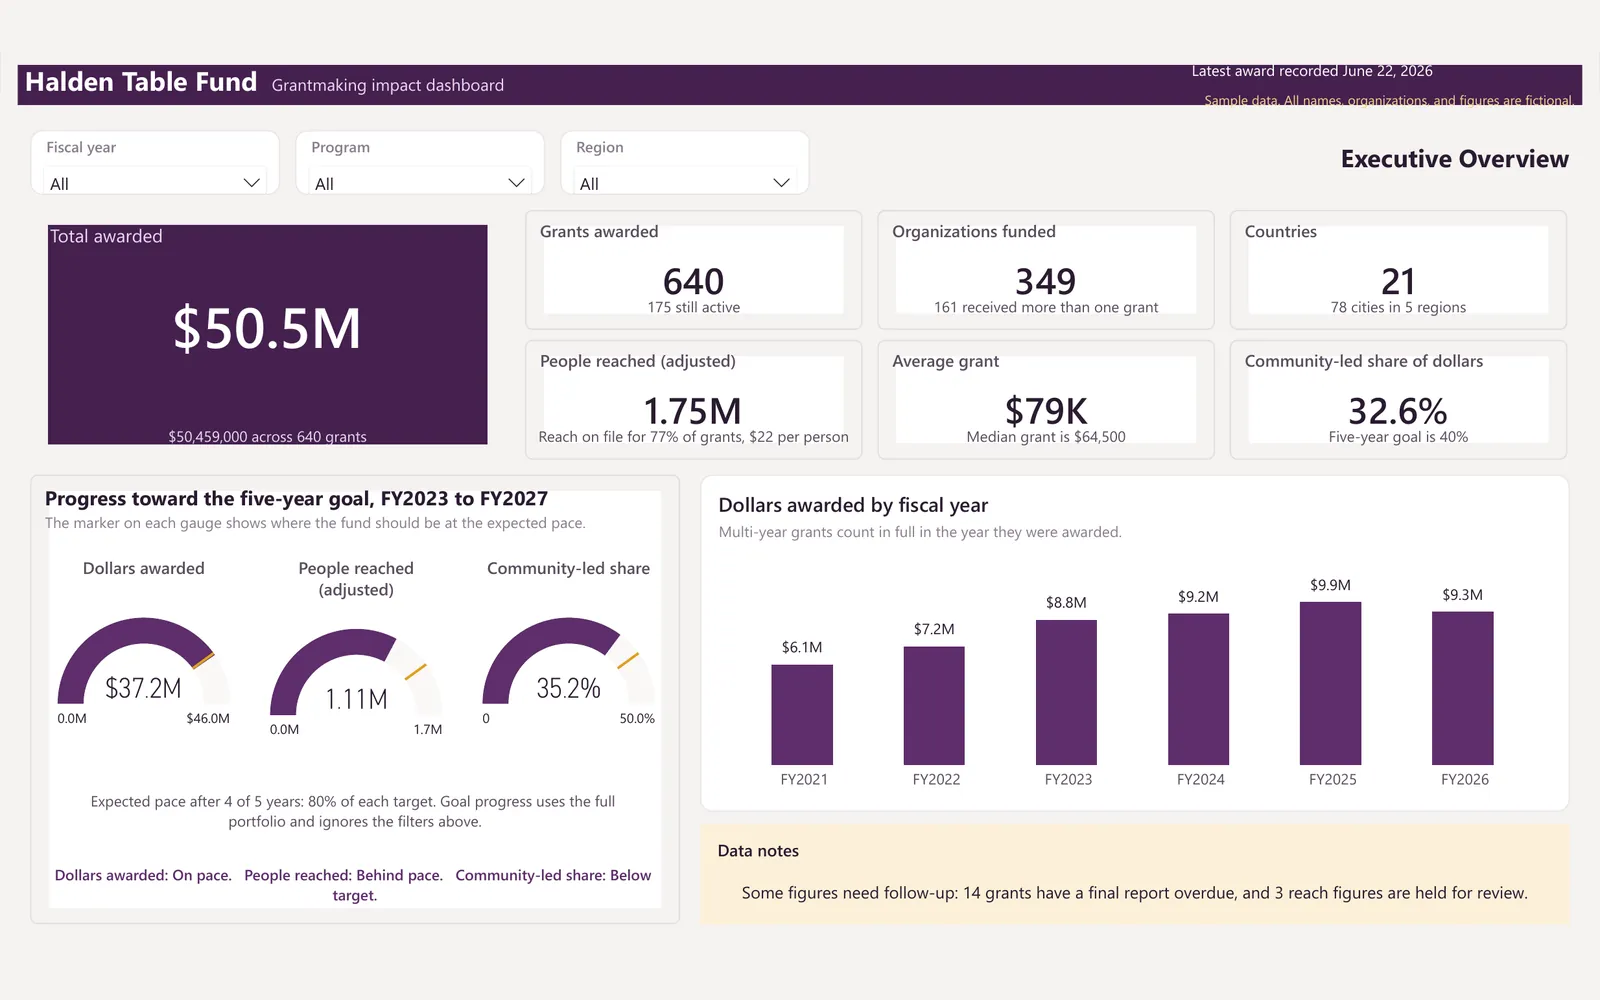
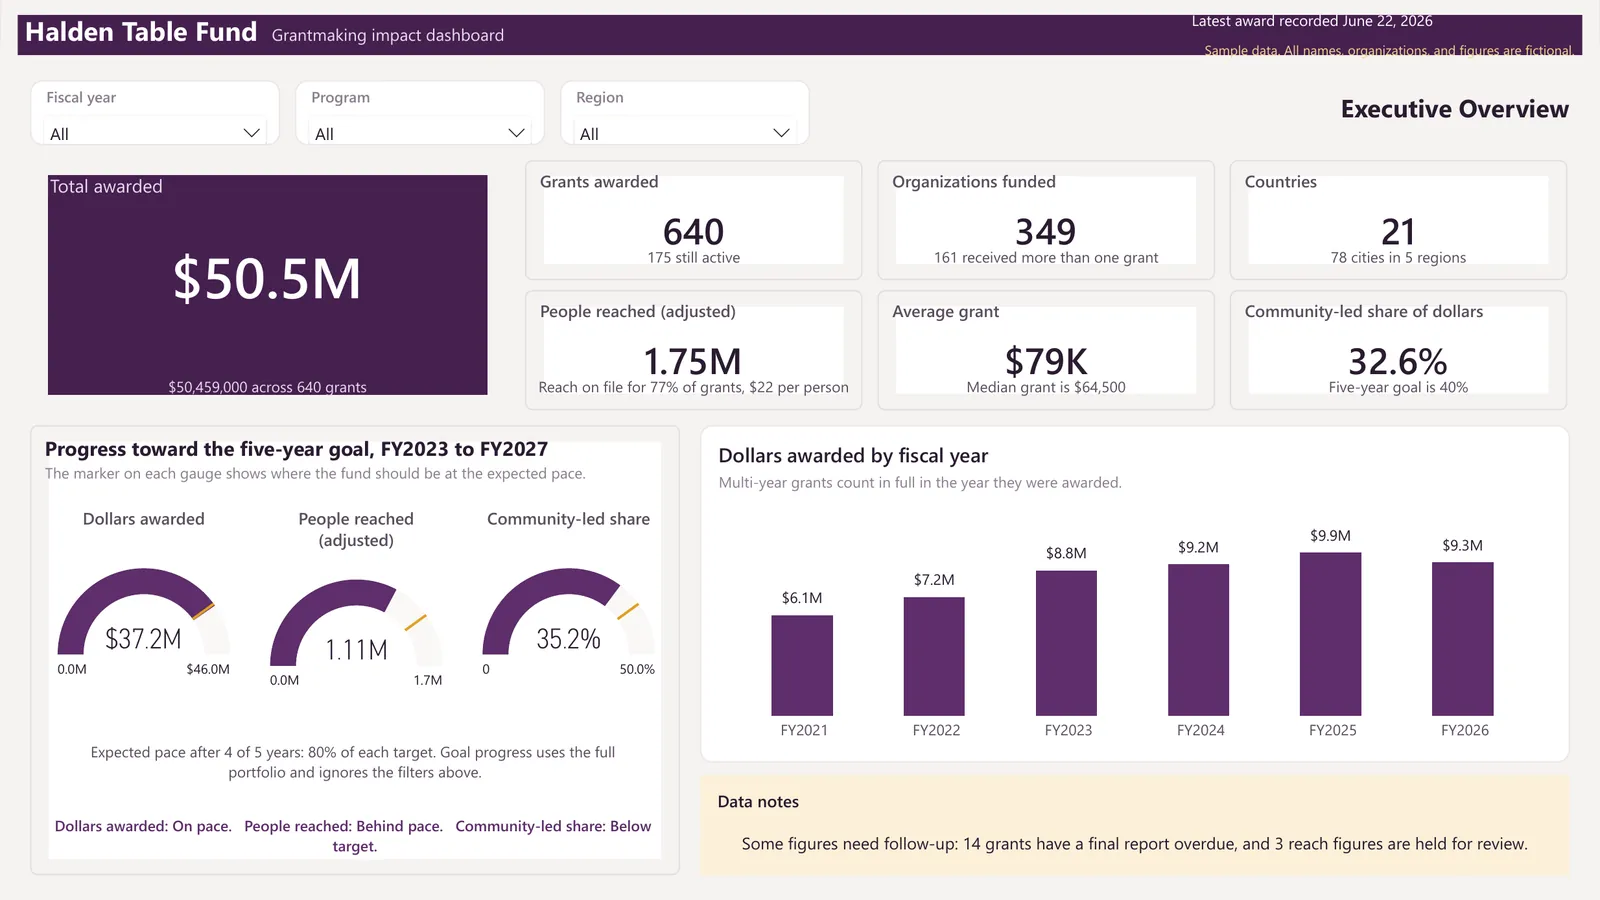
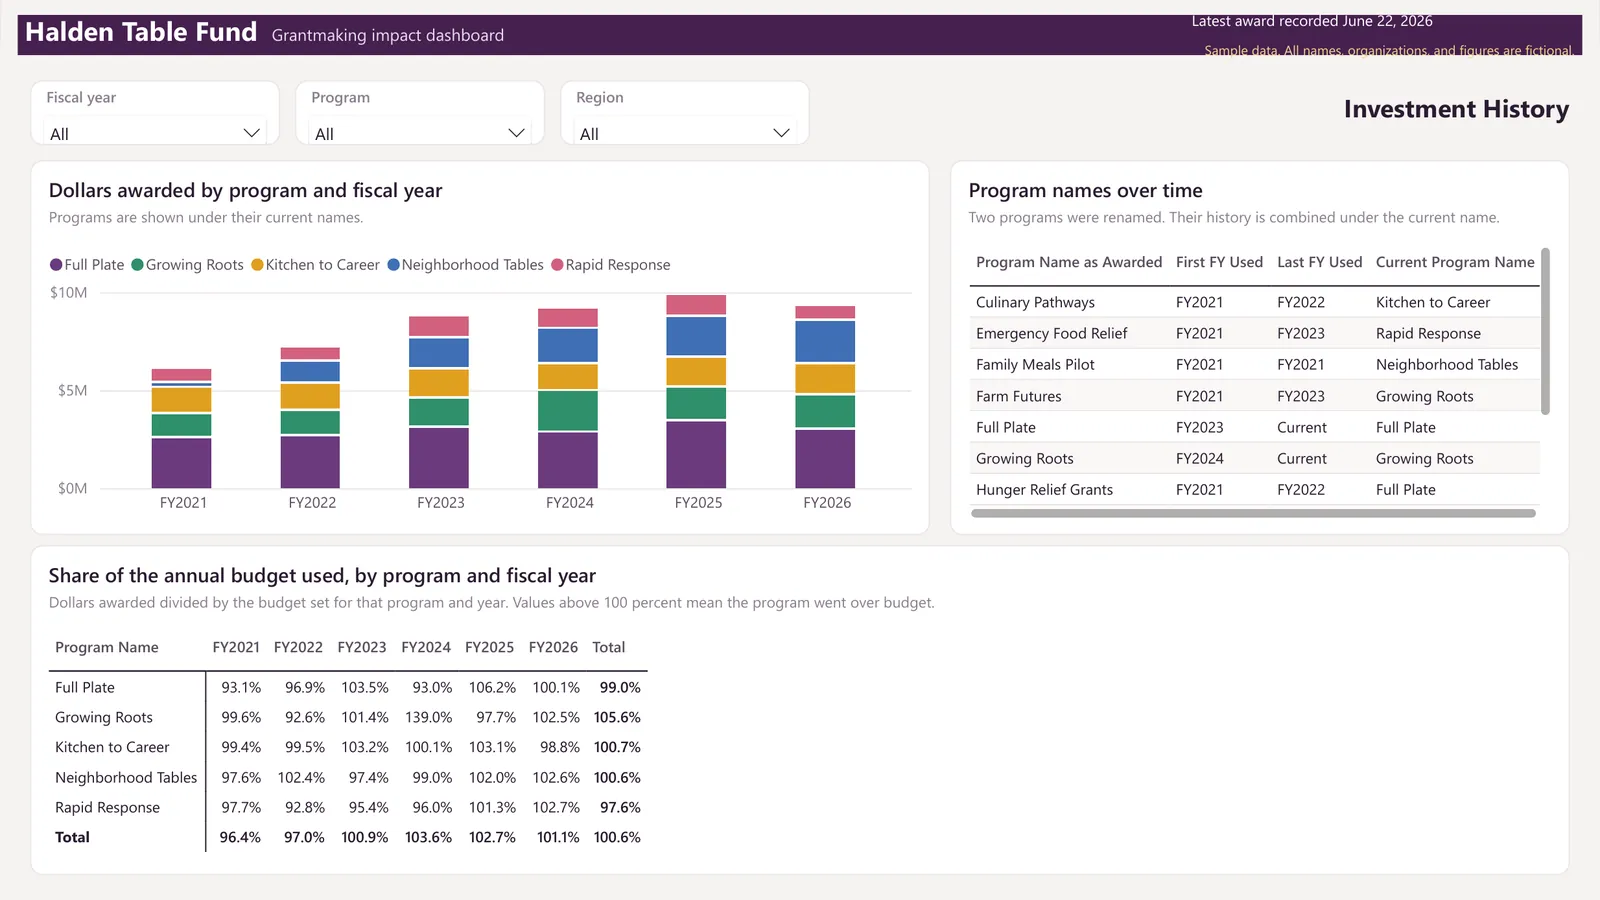
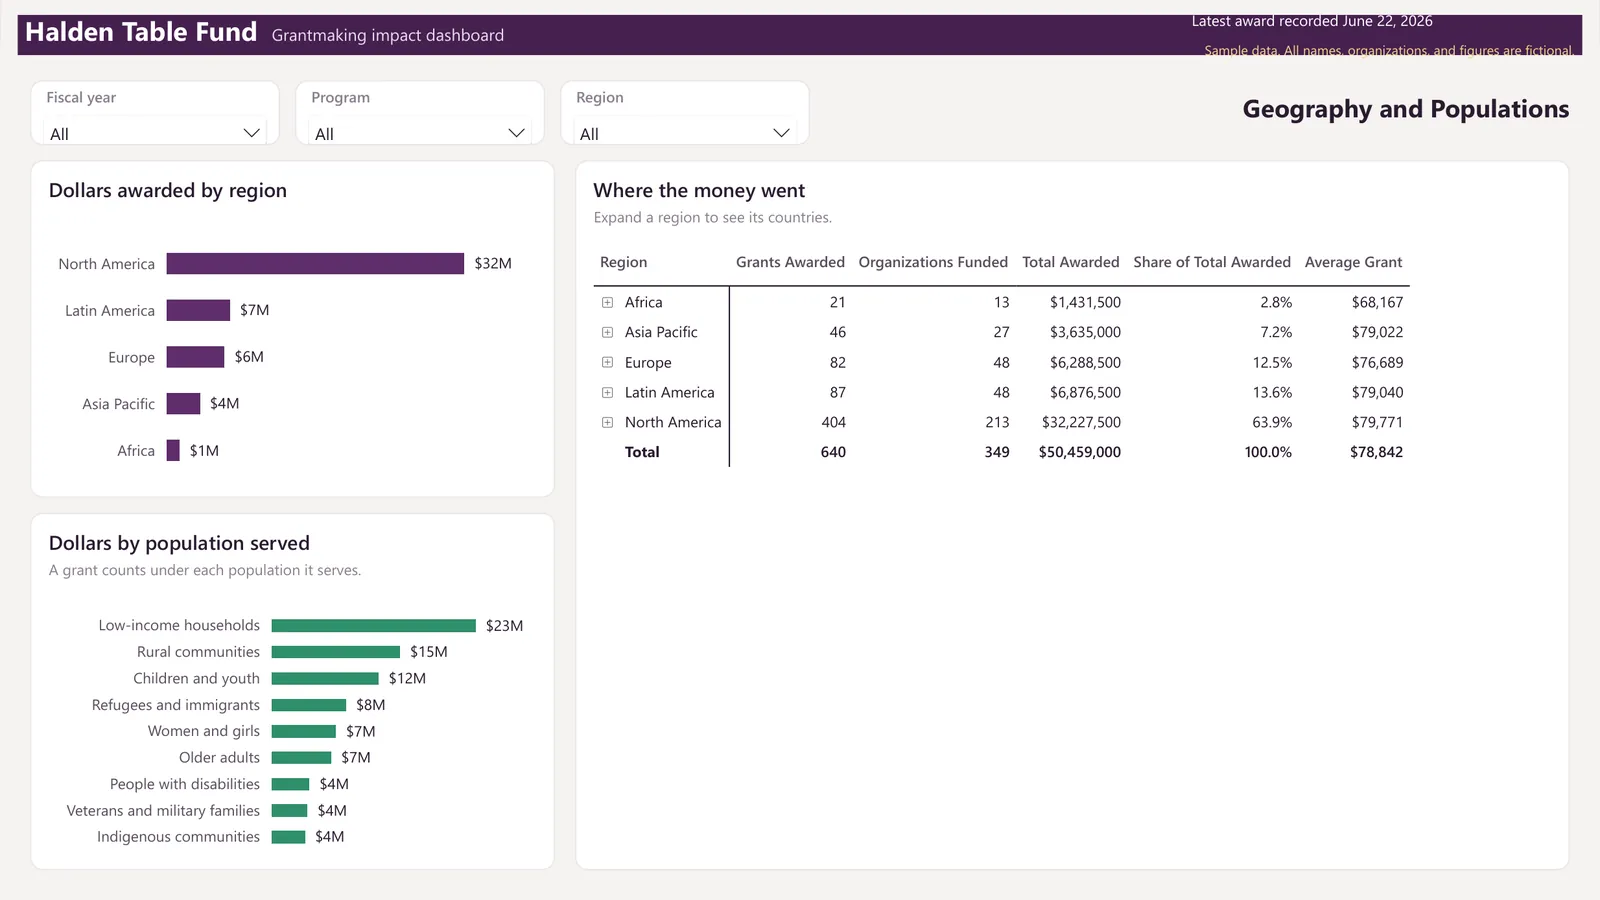
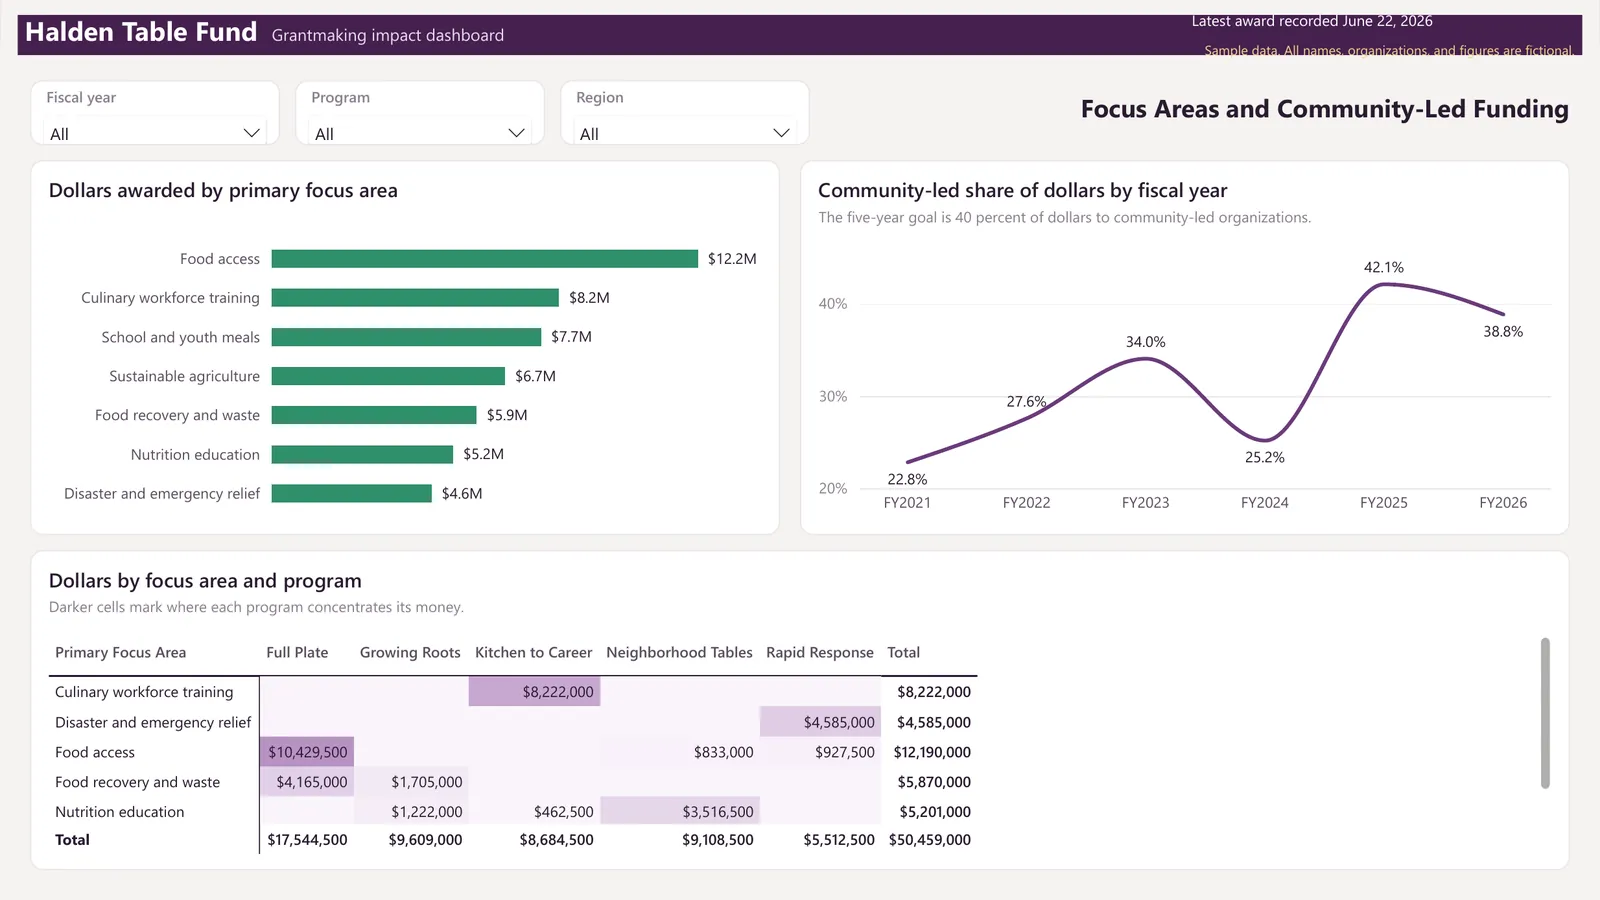
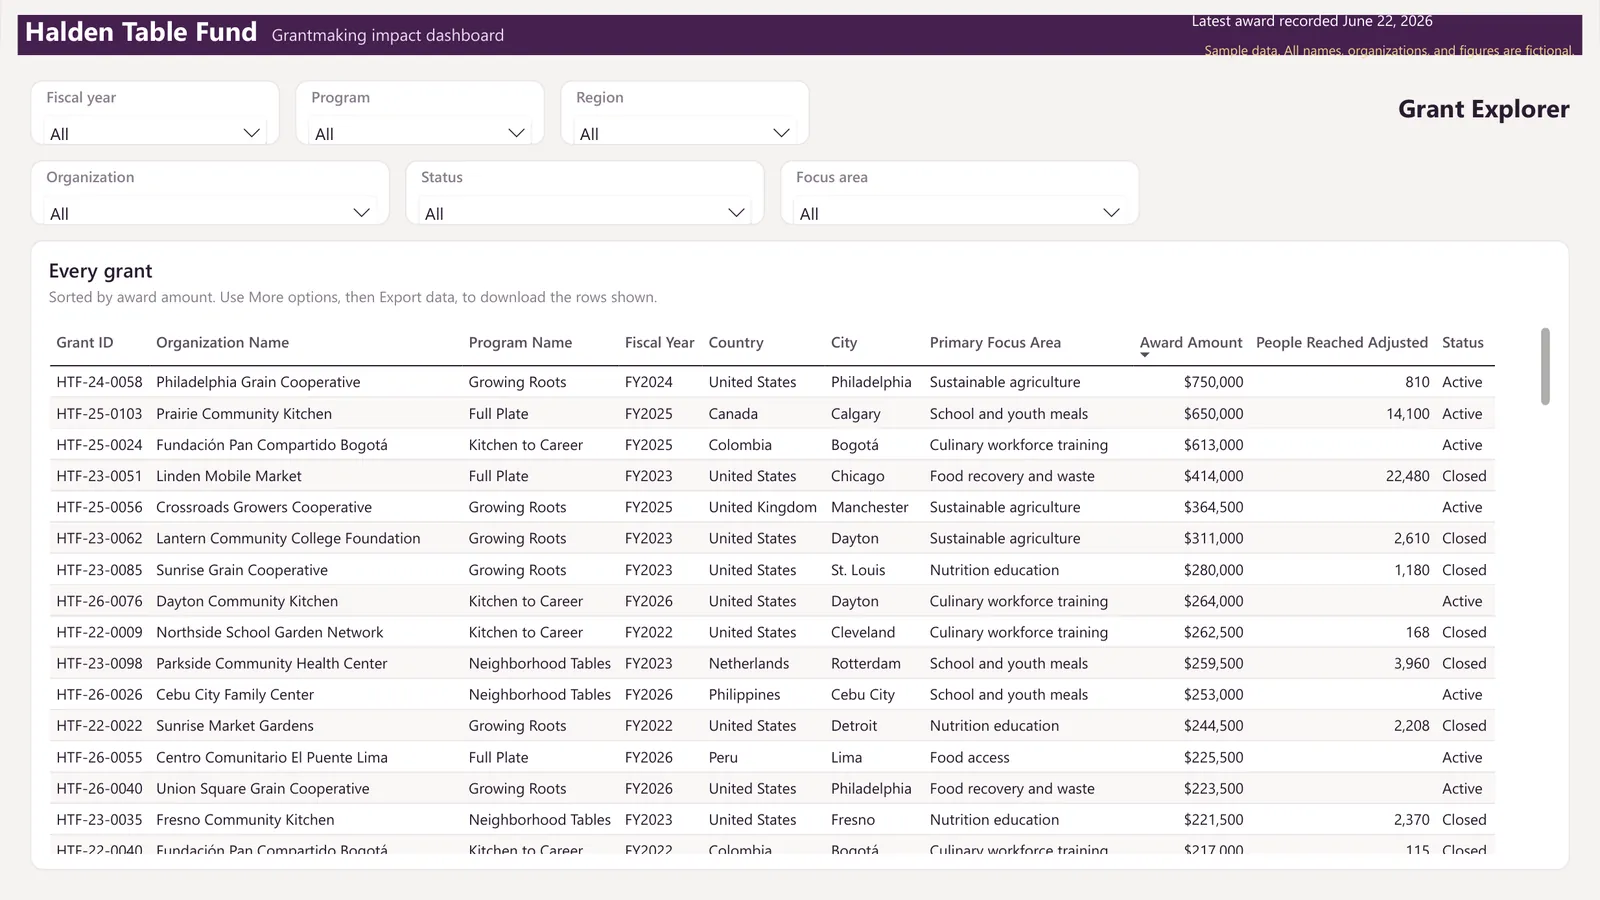
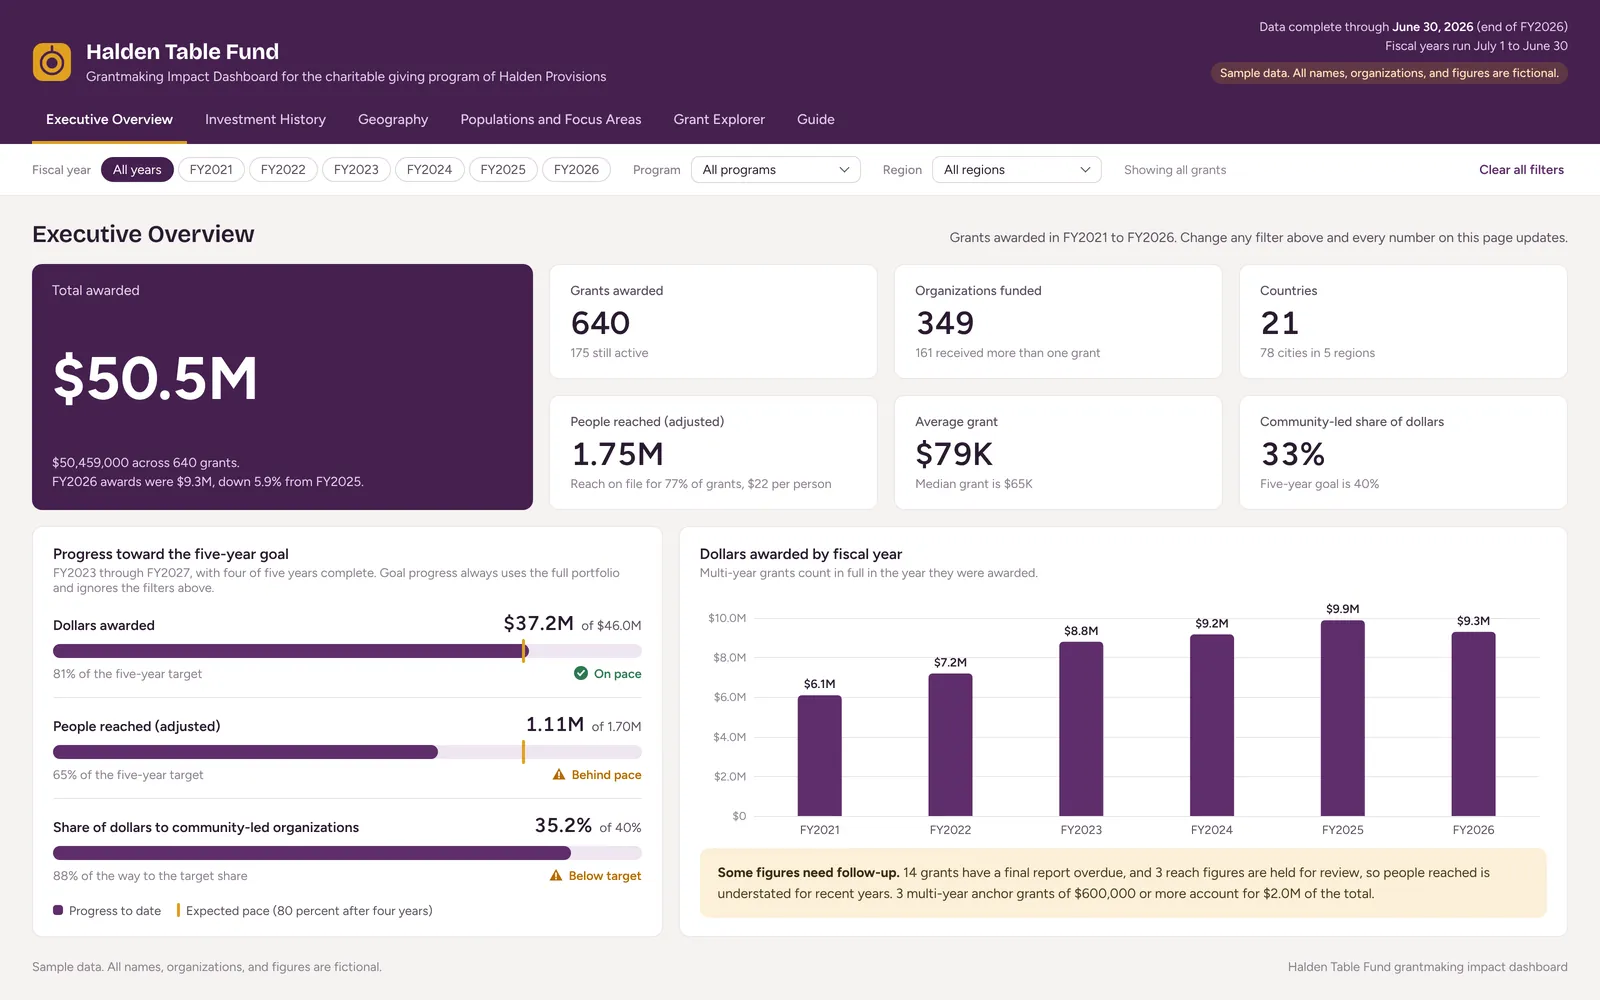
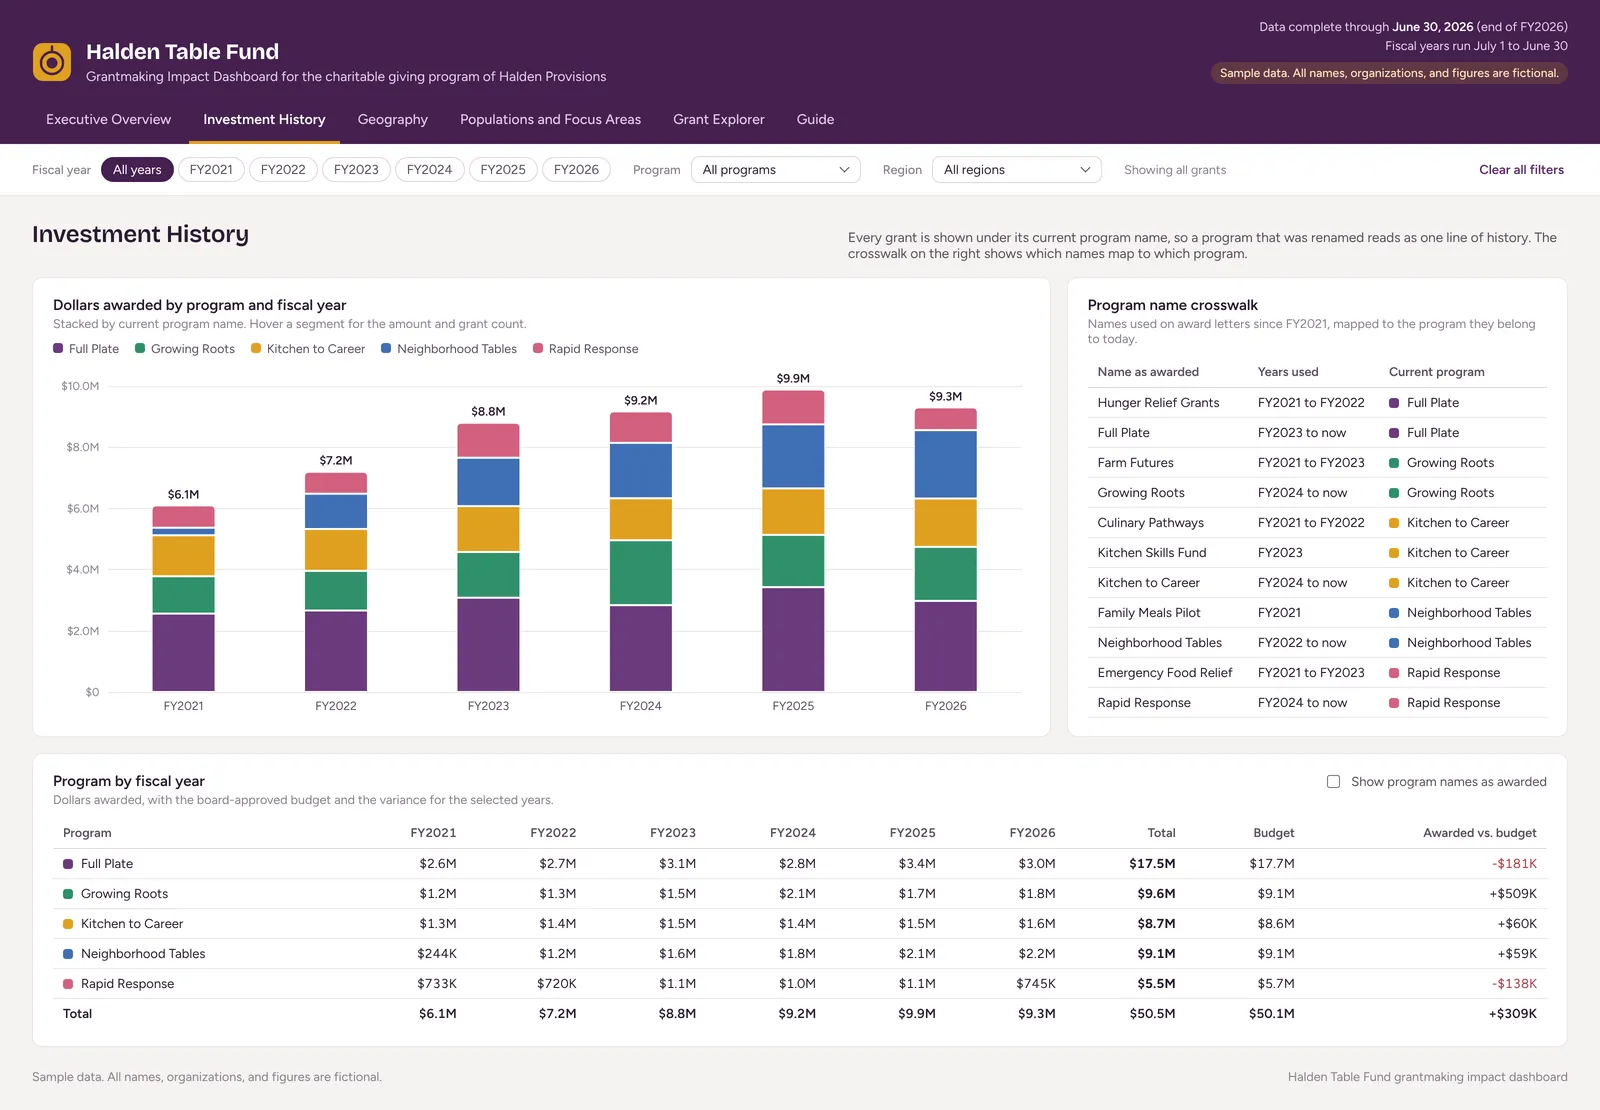
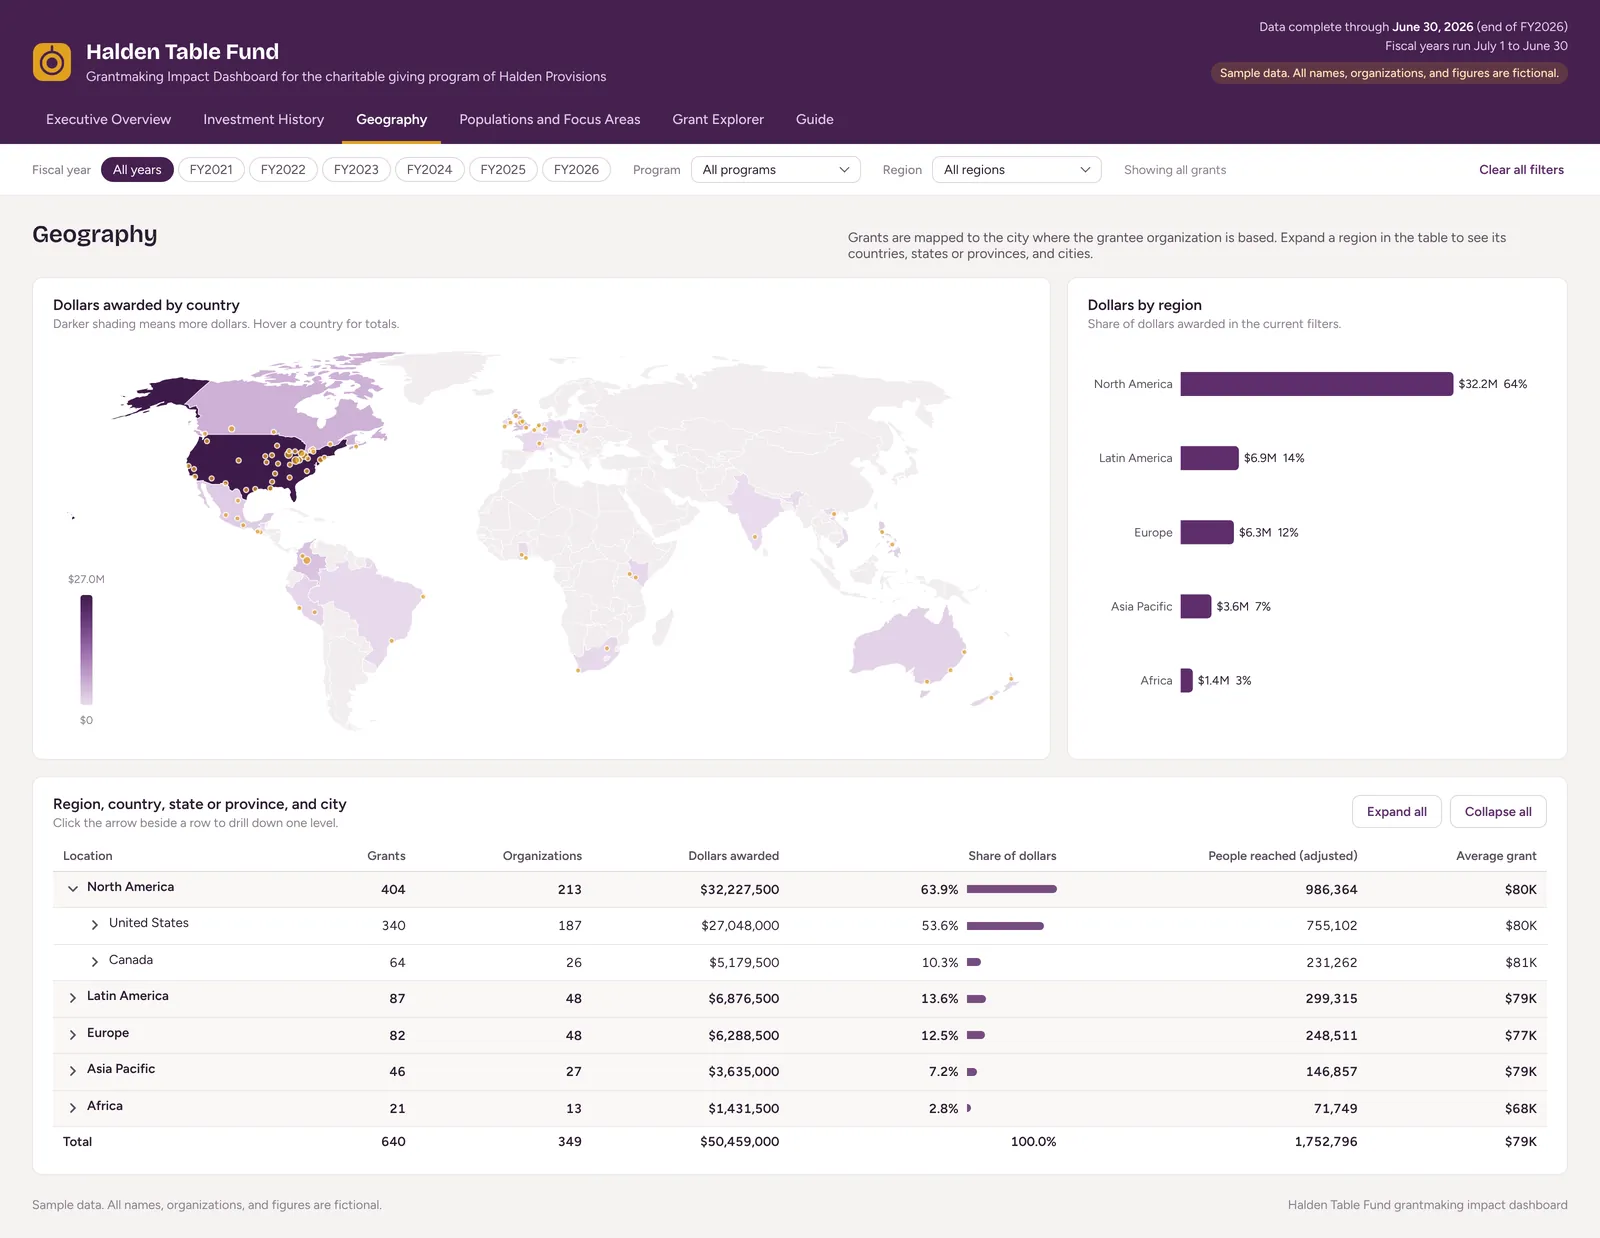
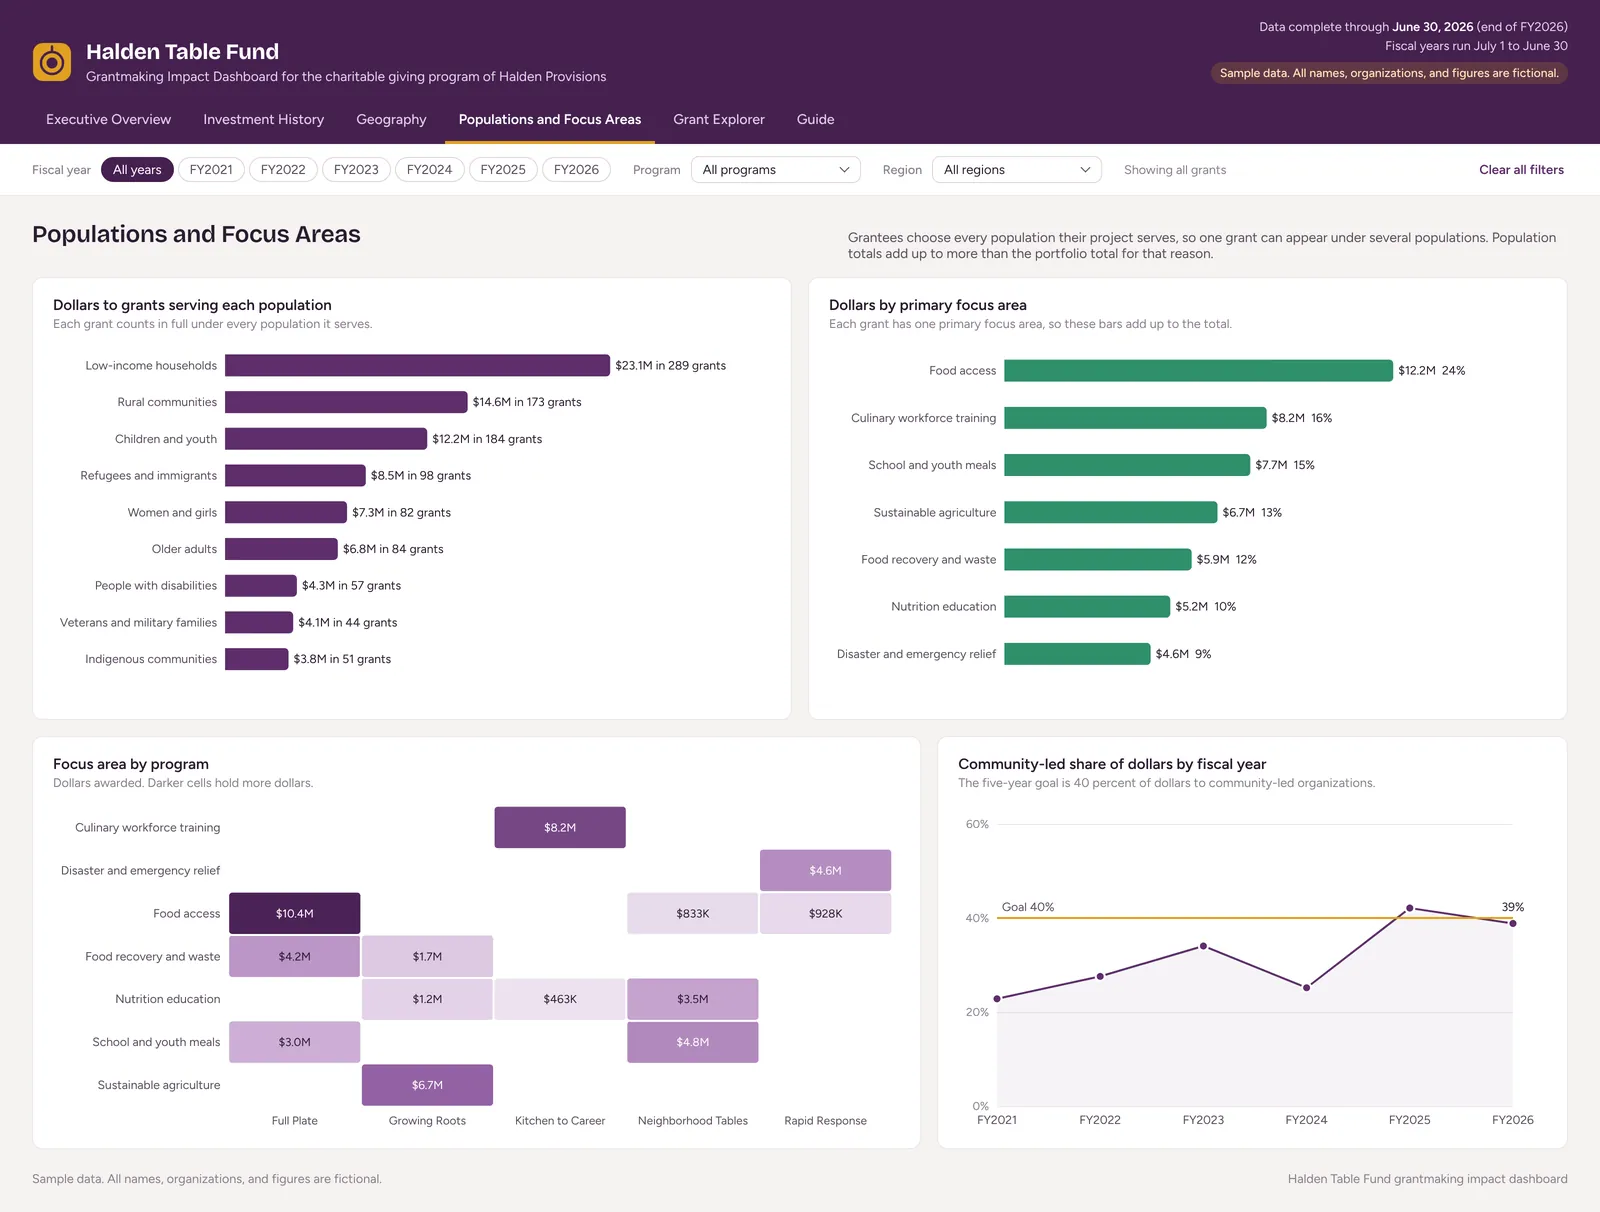
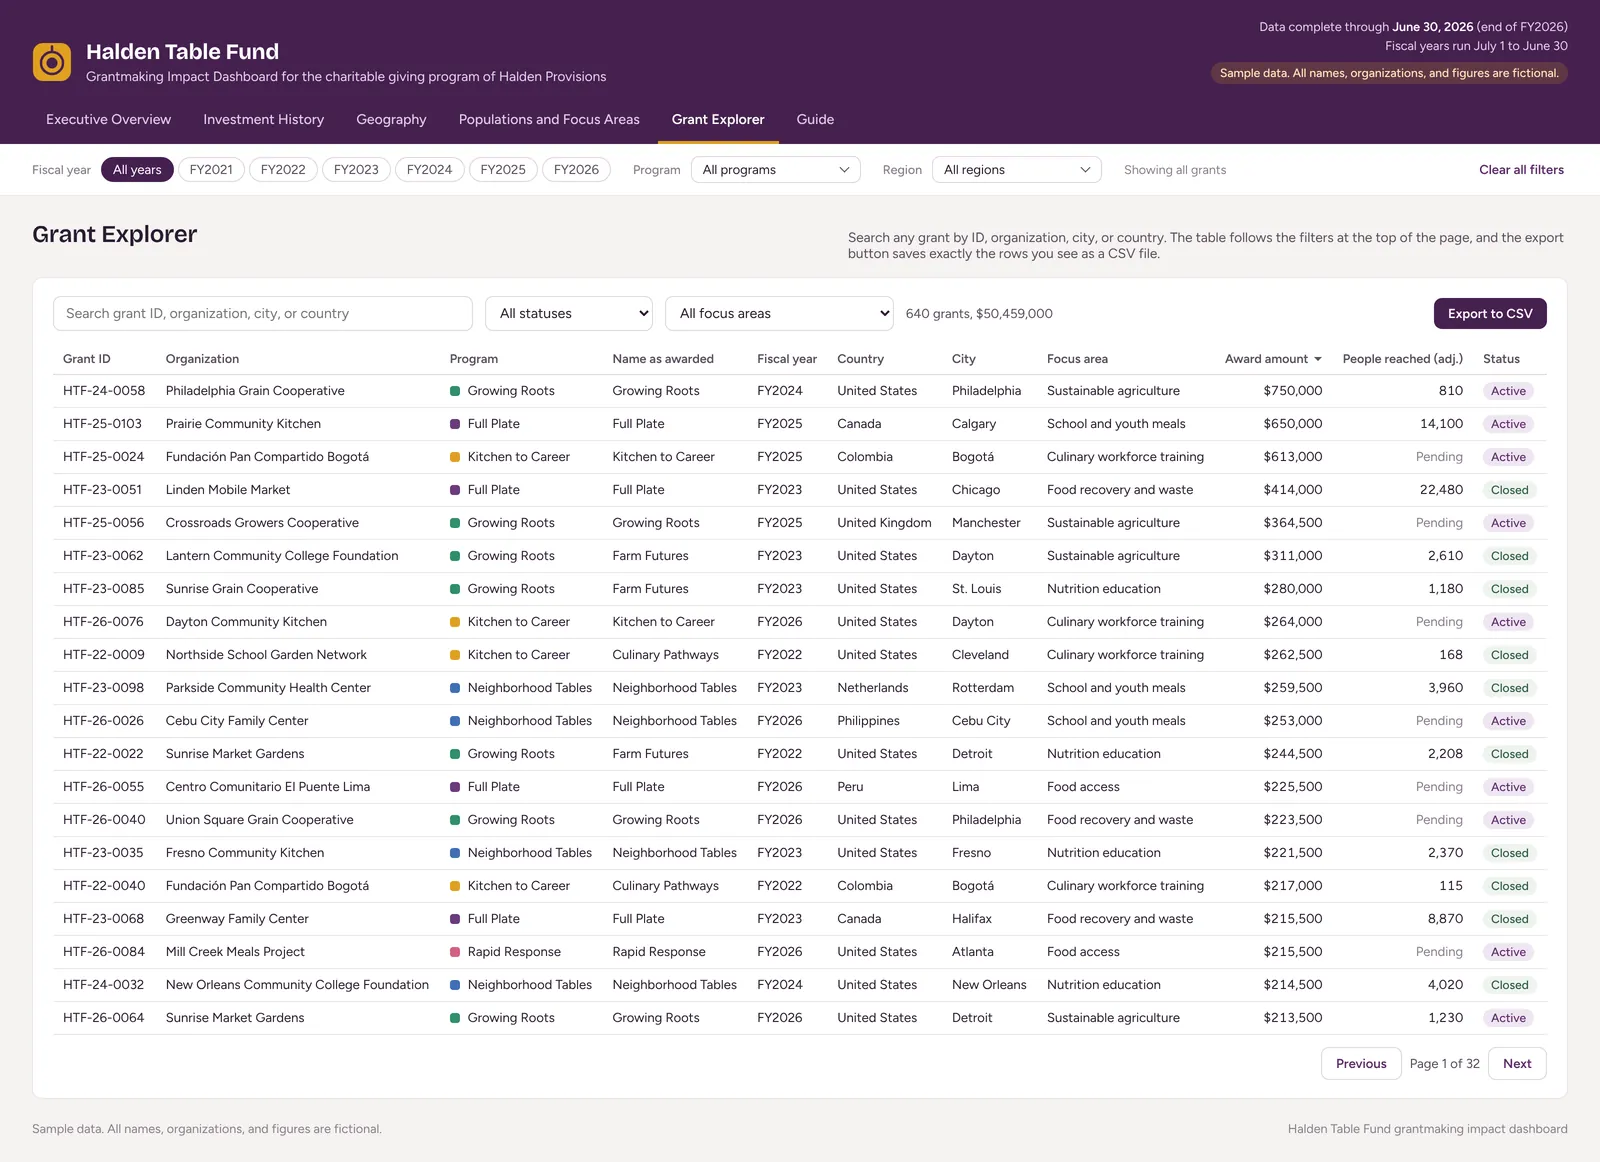
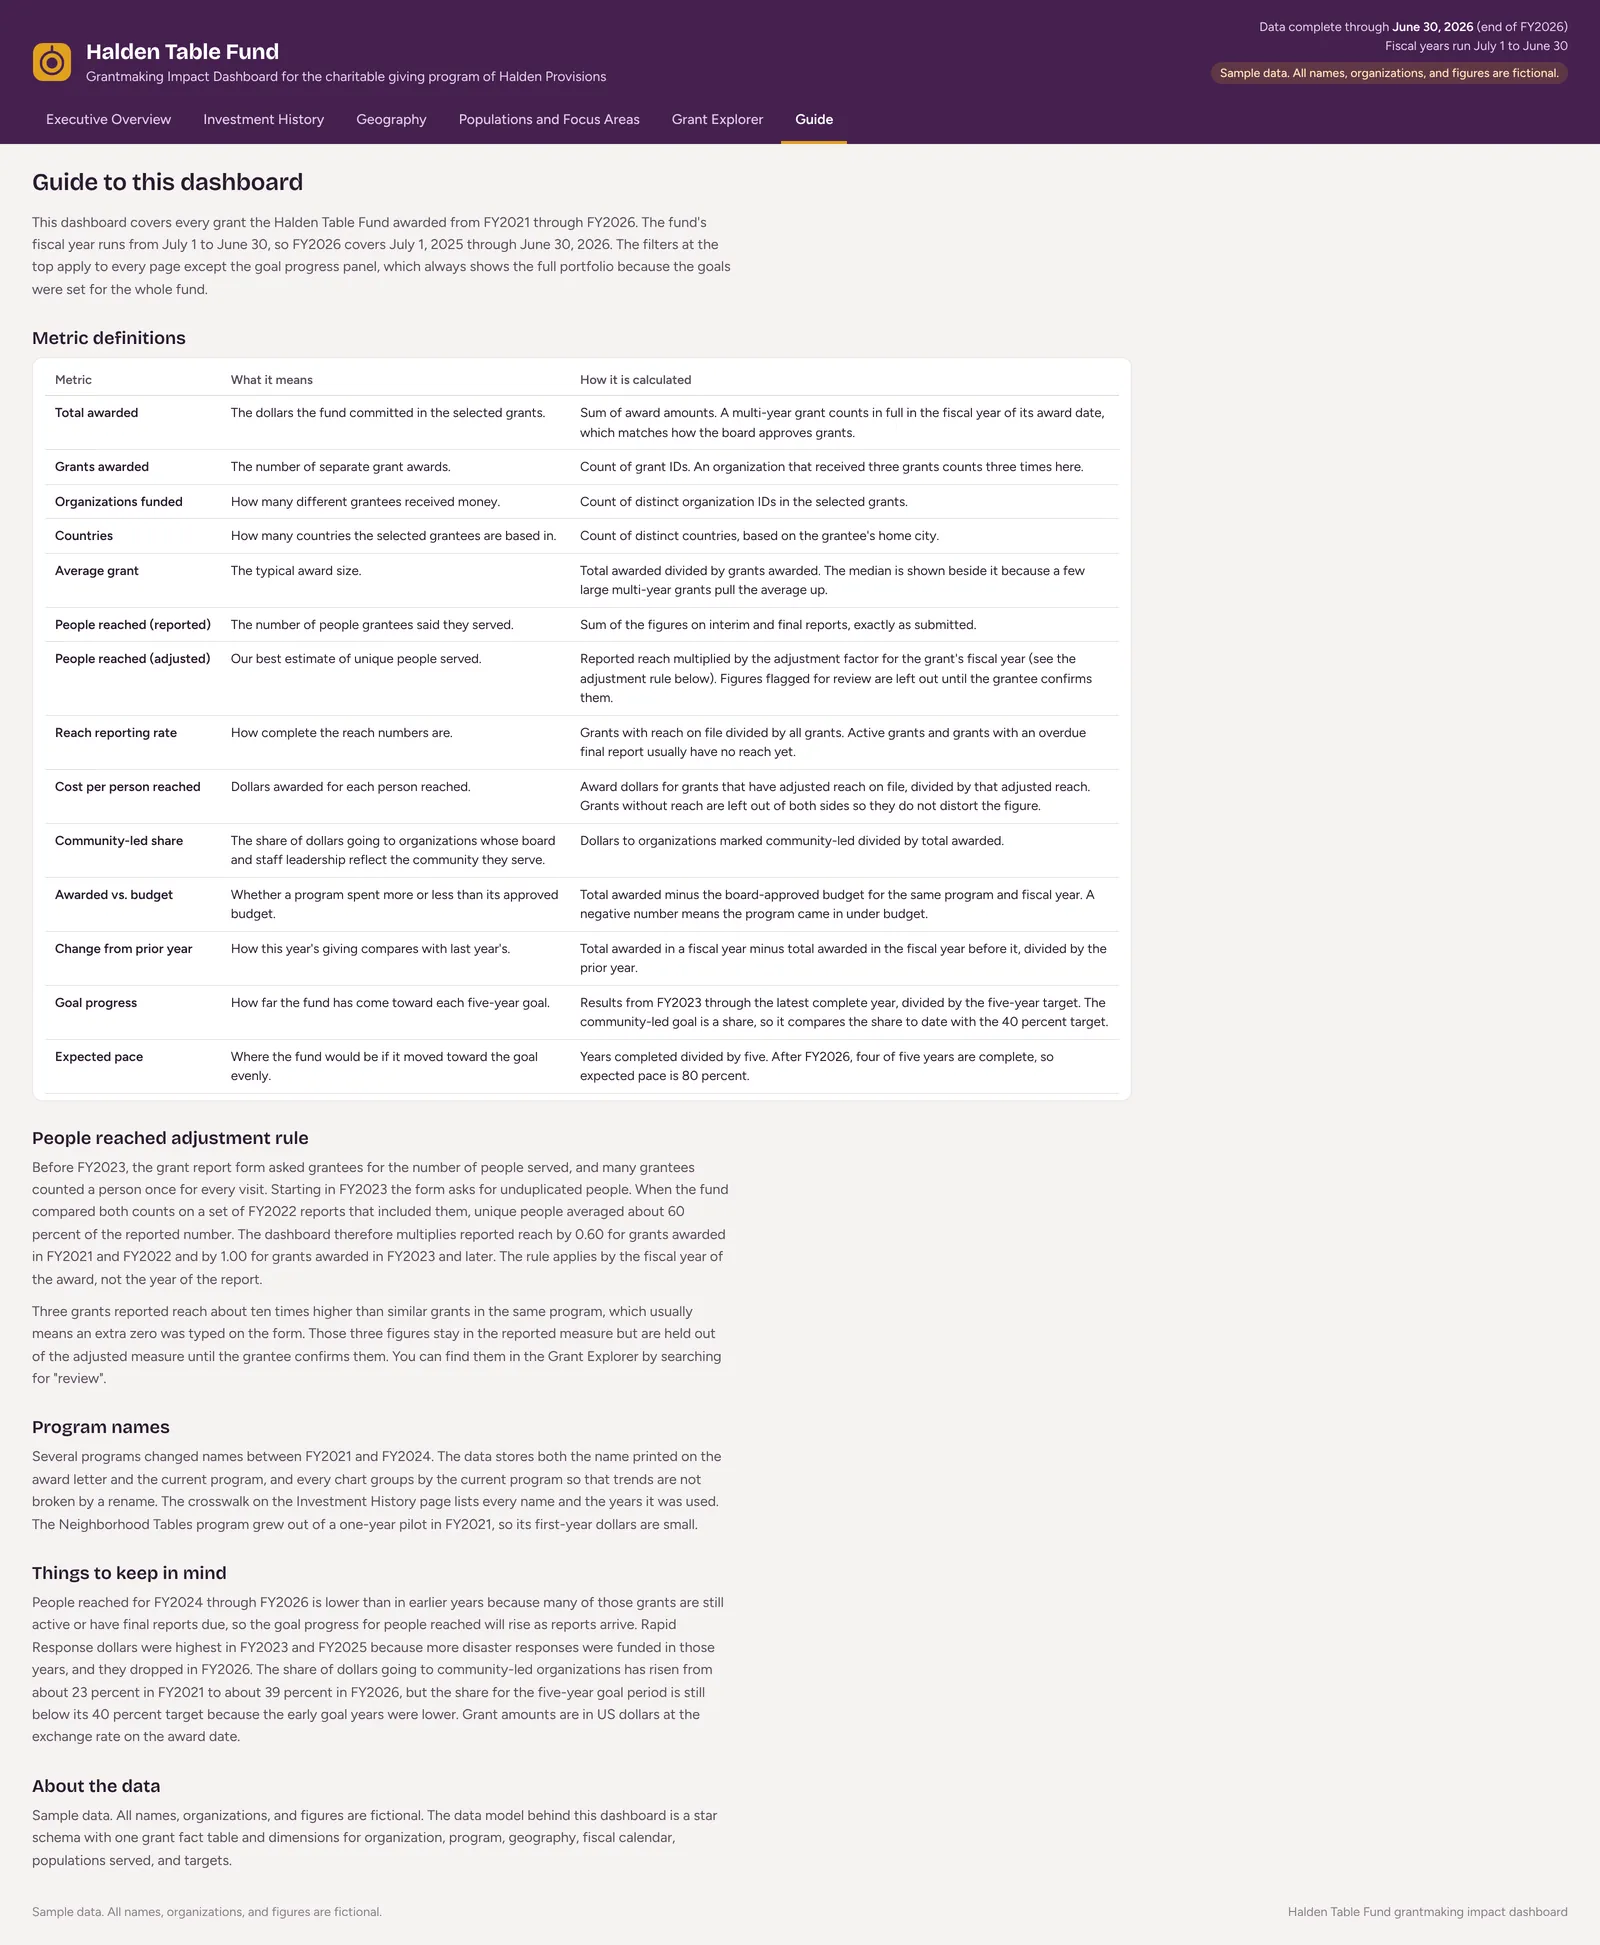
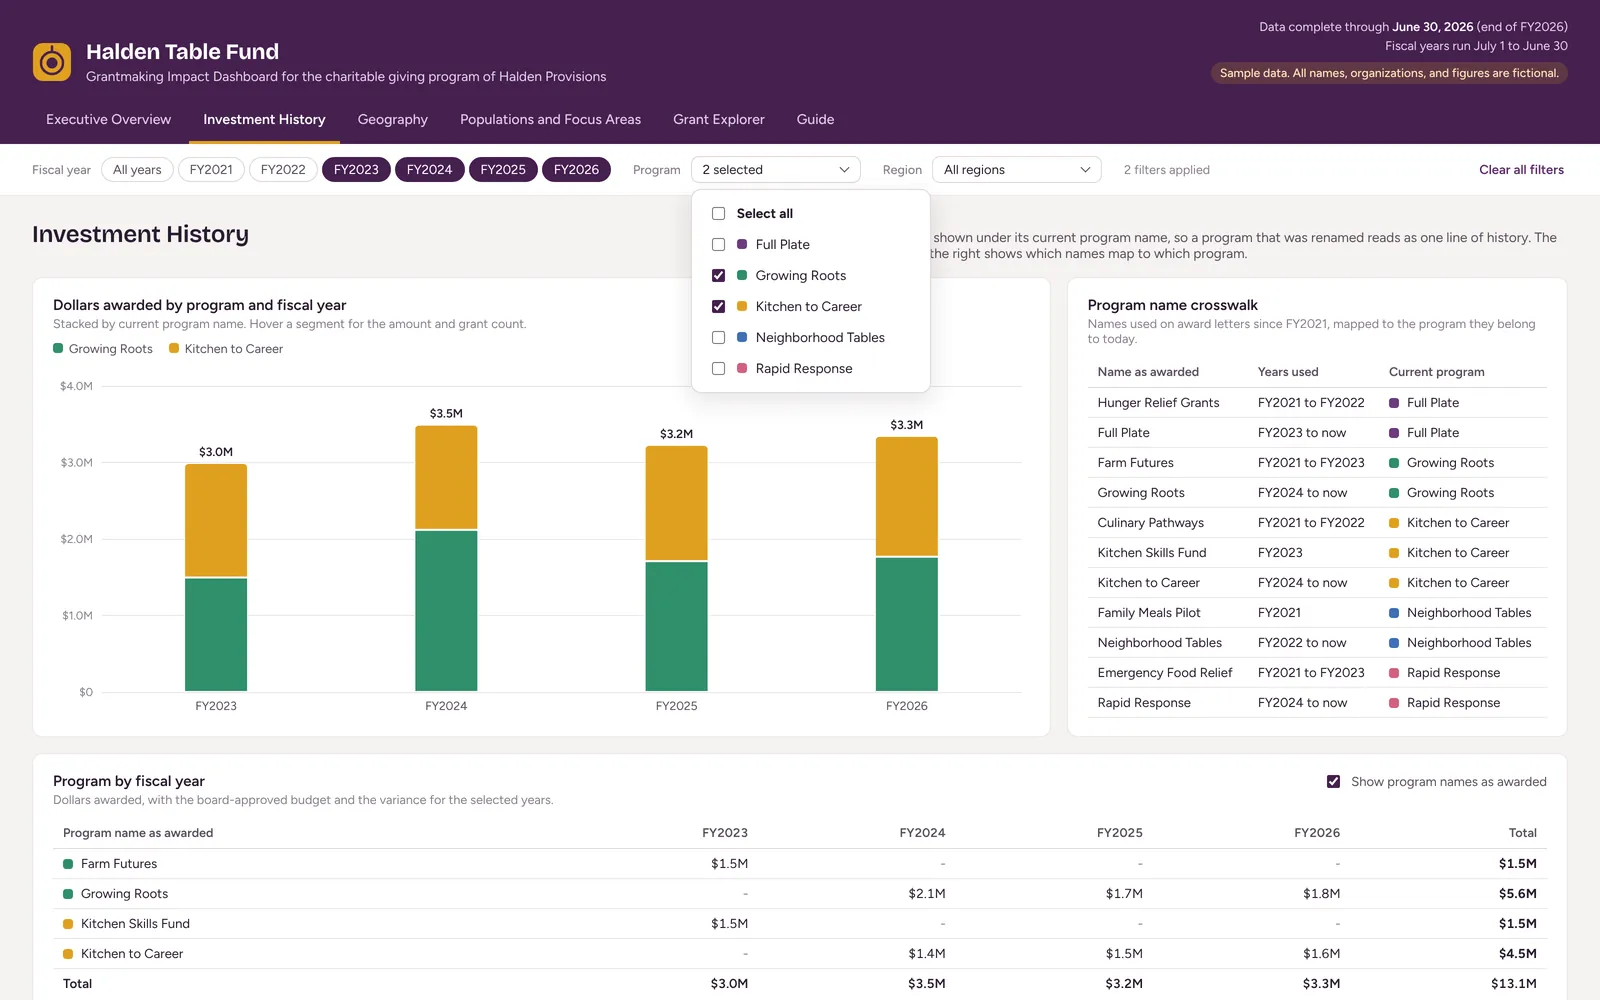
The dashboard follows a fictional food company's giving program across five funding programs, 21 countries, and 78 cities. Leaders can filter by fiscal year, program, and region on every page, see dollars by program over time, drill from region down to city, compare populations served and focus areas, and search or export any grant. Goal progress bars compare results with the expected pace, and a data note points out overdue reports and reach figures held for review.
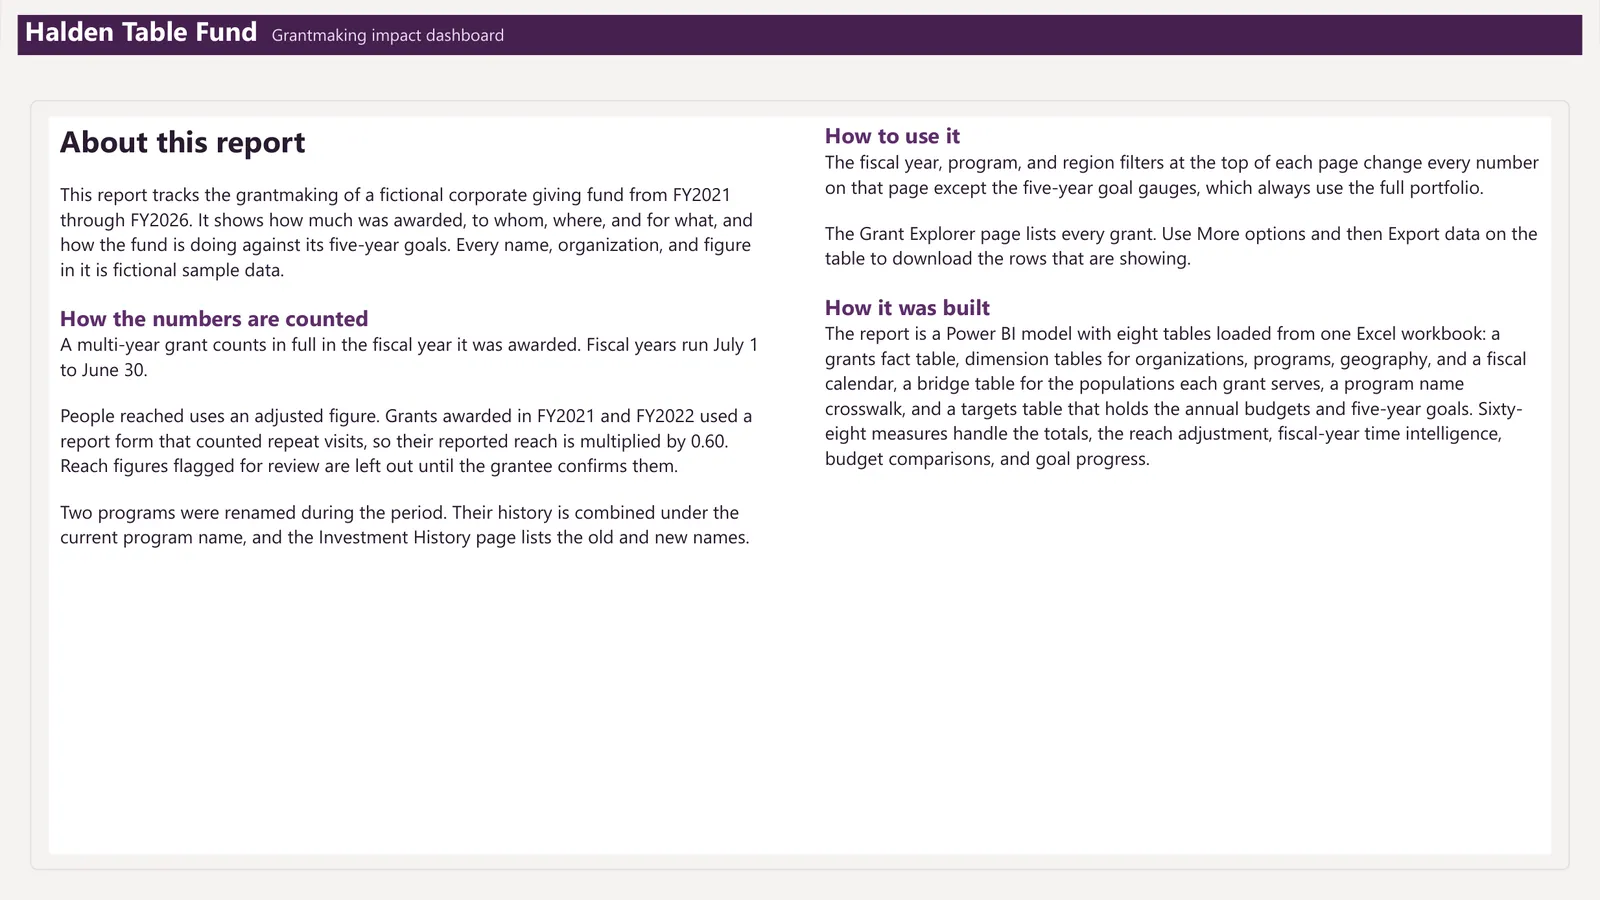
The package includes the finished Power BI report file and the rebuild kit behind it: a star schema in Excel and CSV (grants, organizations, programs with a name crosswalk, geography, fiscal calendar, populations, and targets), a report theme, and a rebuild guide with every DAX measure, including fiscal-year time intelligence, budget variance, the people-reached adjustment rule, and goal progress. It also includes a print-ready quarterly summary page for a giving committee.