Community Health and Hospital Community Benefit

Community Benefit Dashboard

This interactive dashboard shows a hospital system's community benefit across three fiscal years, built from the same sample data as the reporting workbook. It comes with star-schema data files, a Power BI theme, and a rebuild guide with every DAX measure.

Sample data. All names, organizations, and figures are fictional.

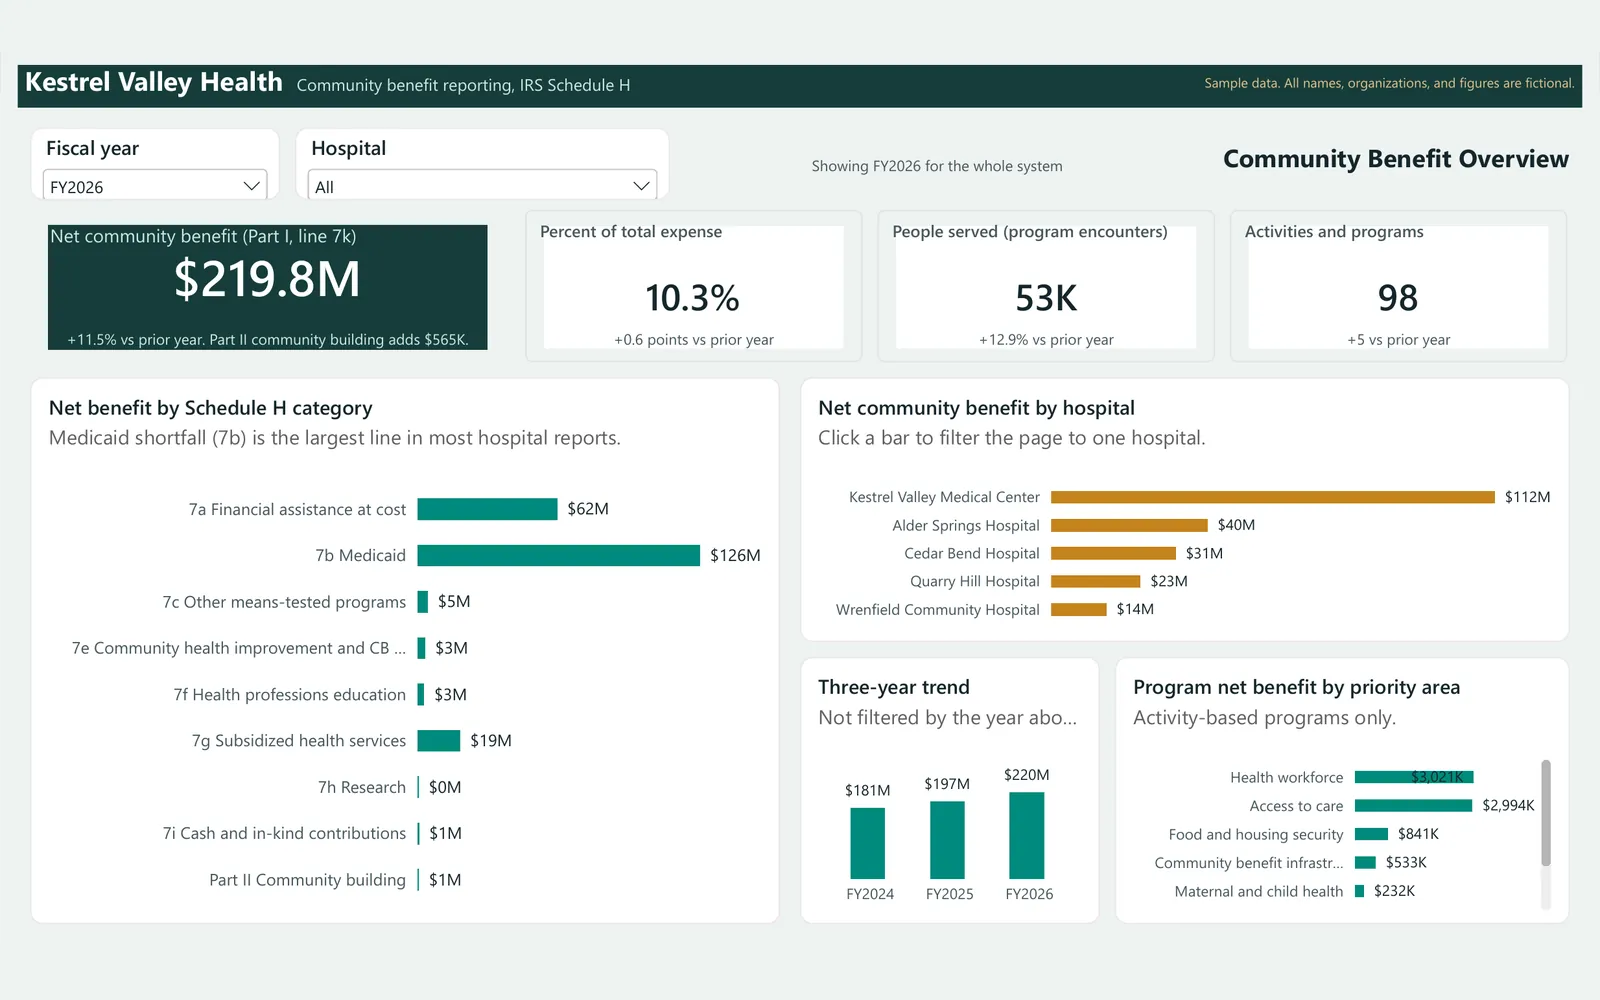
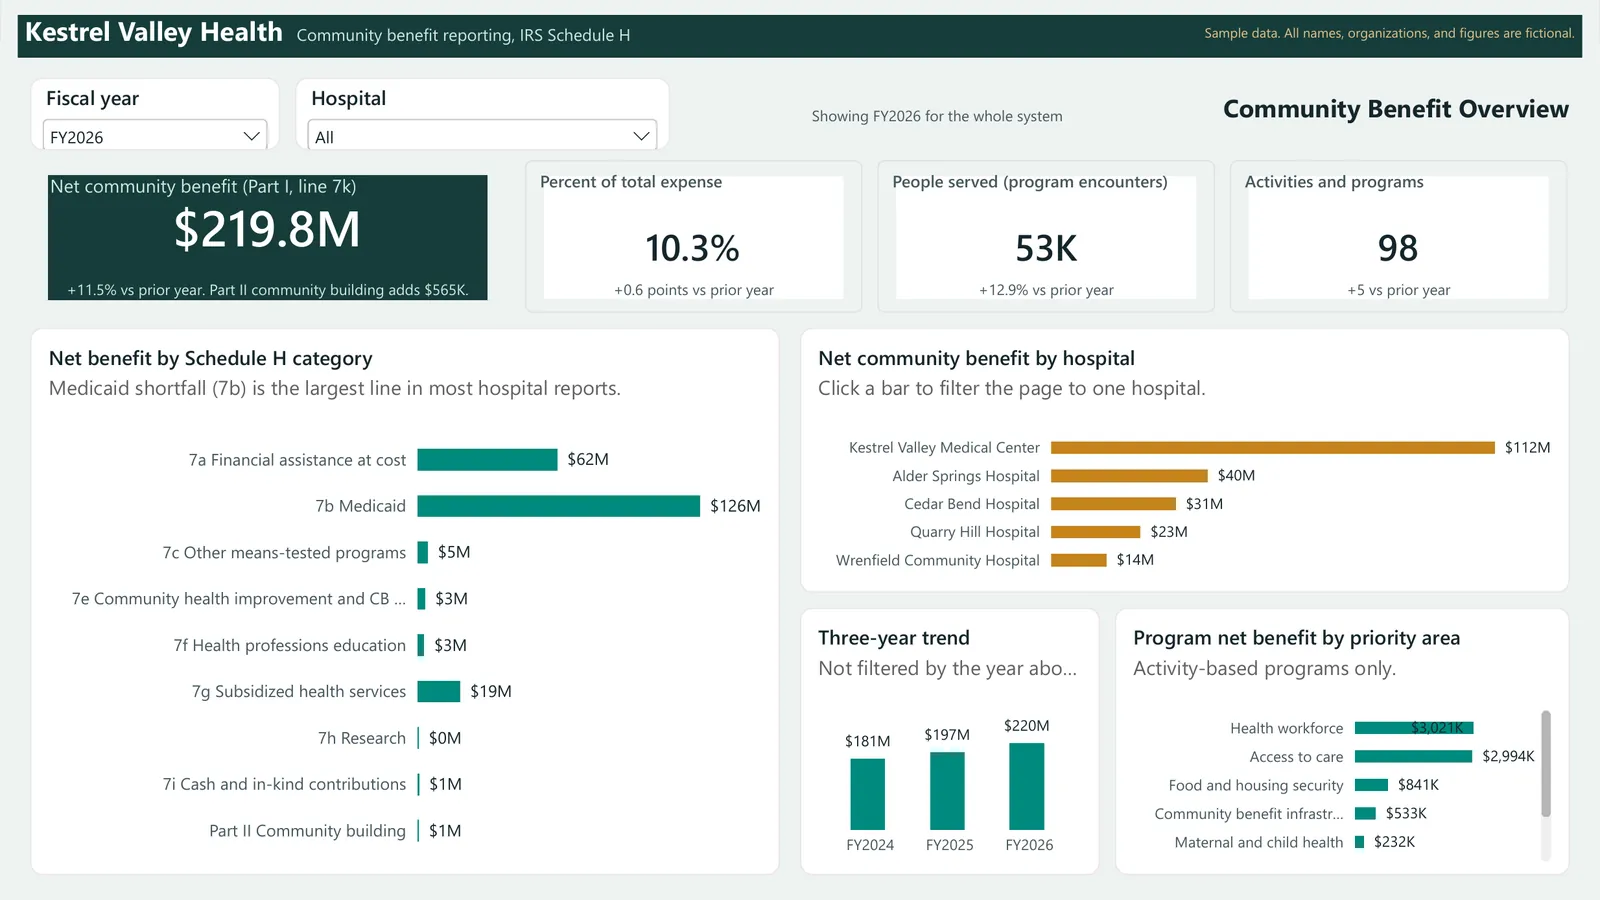
Community Benefit Dashboard: Powerbi overview community benefit dashboardOpen larger image

About this sample

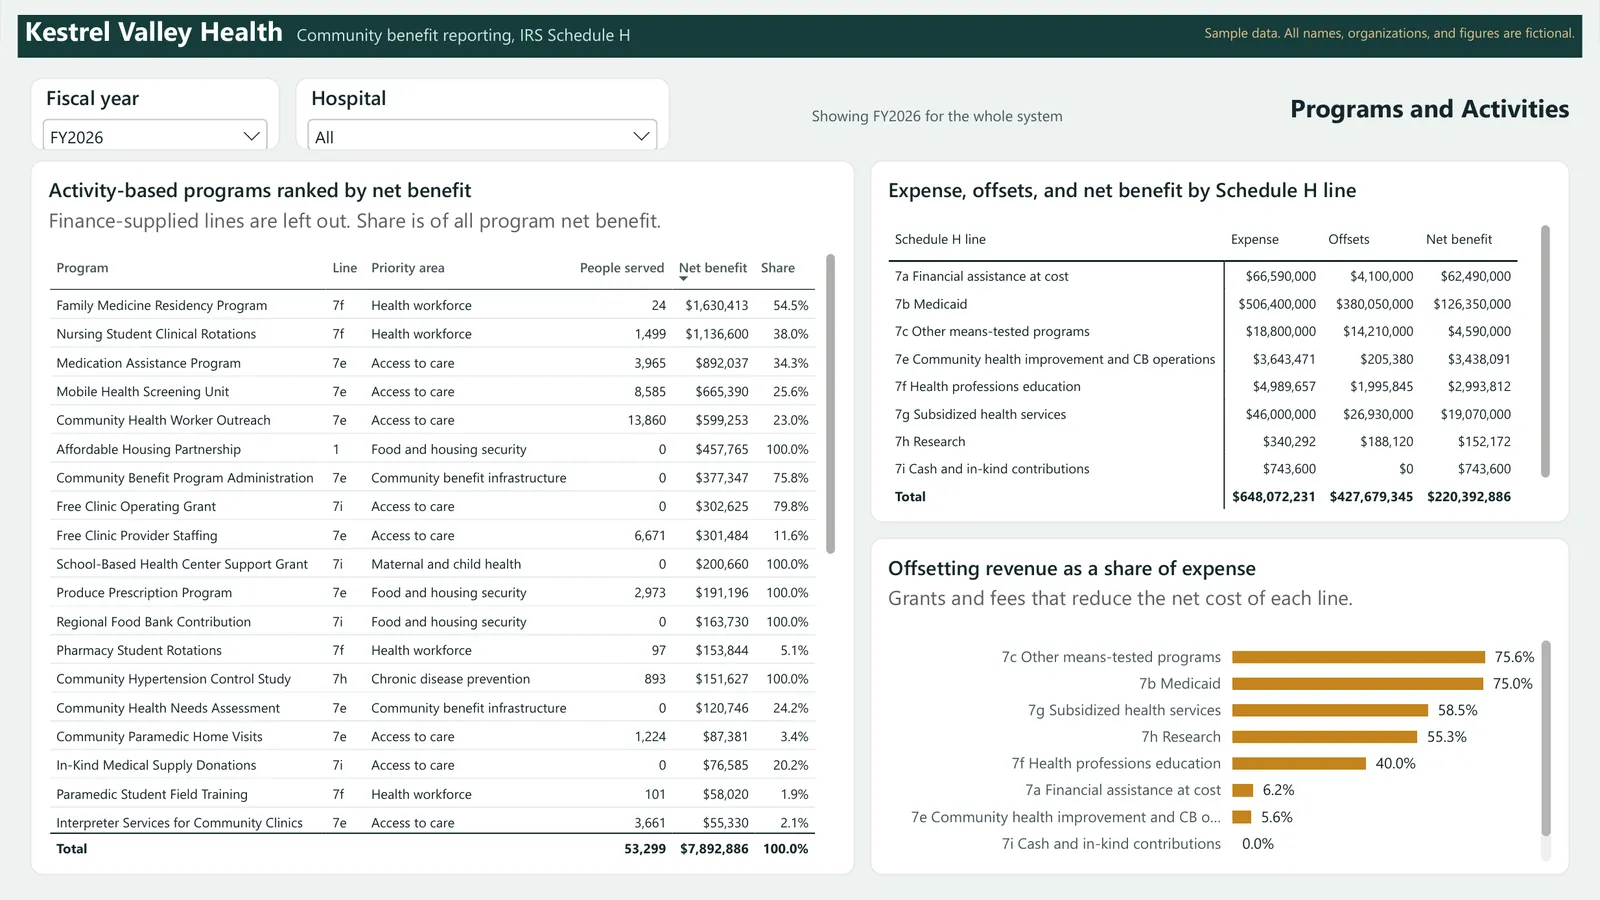
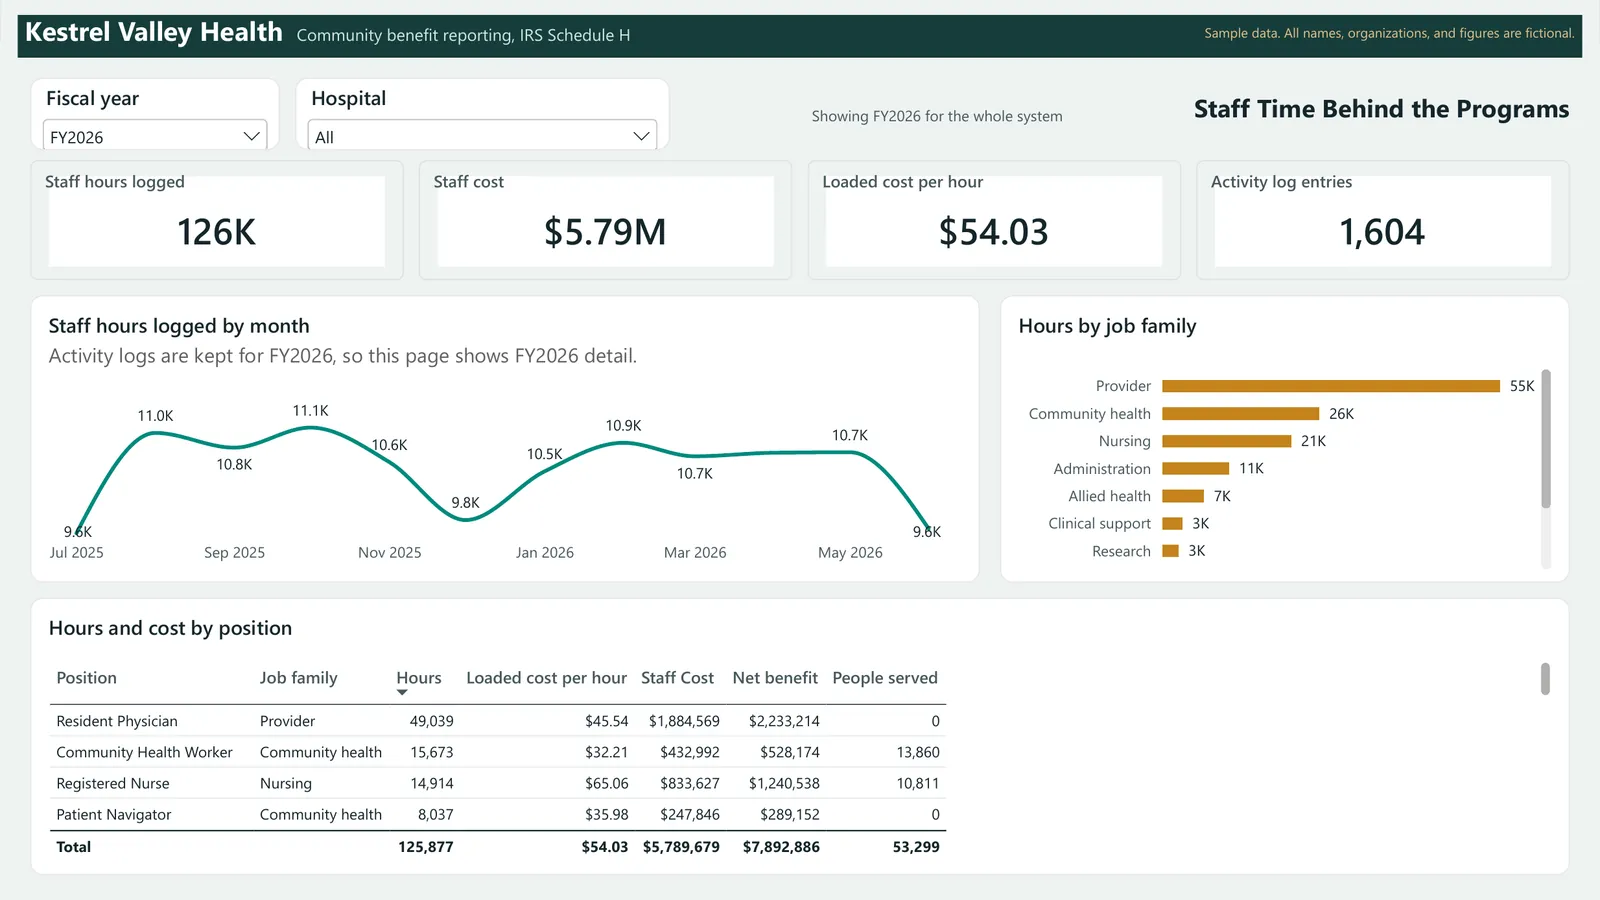
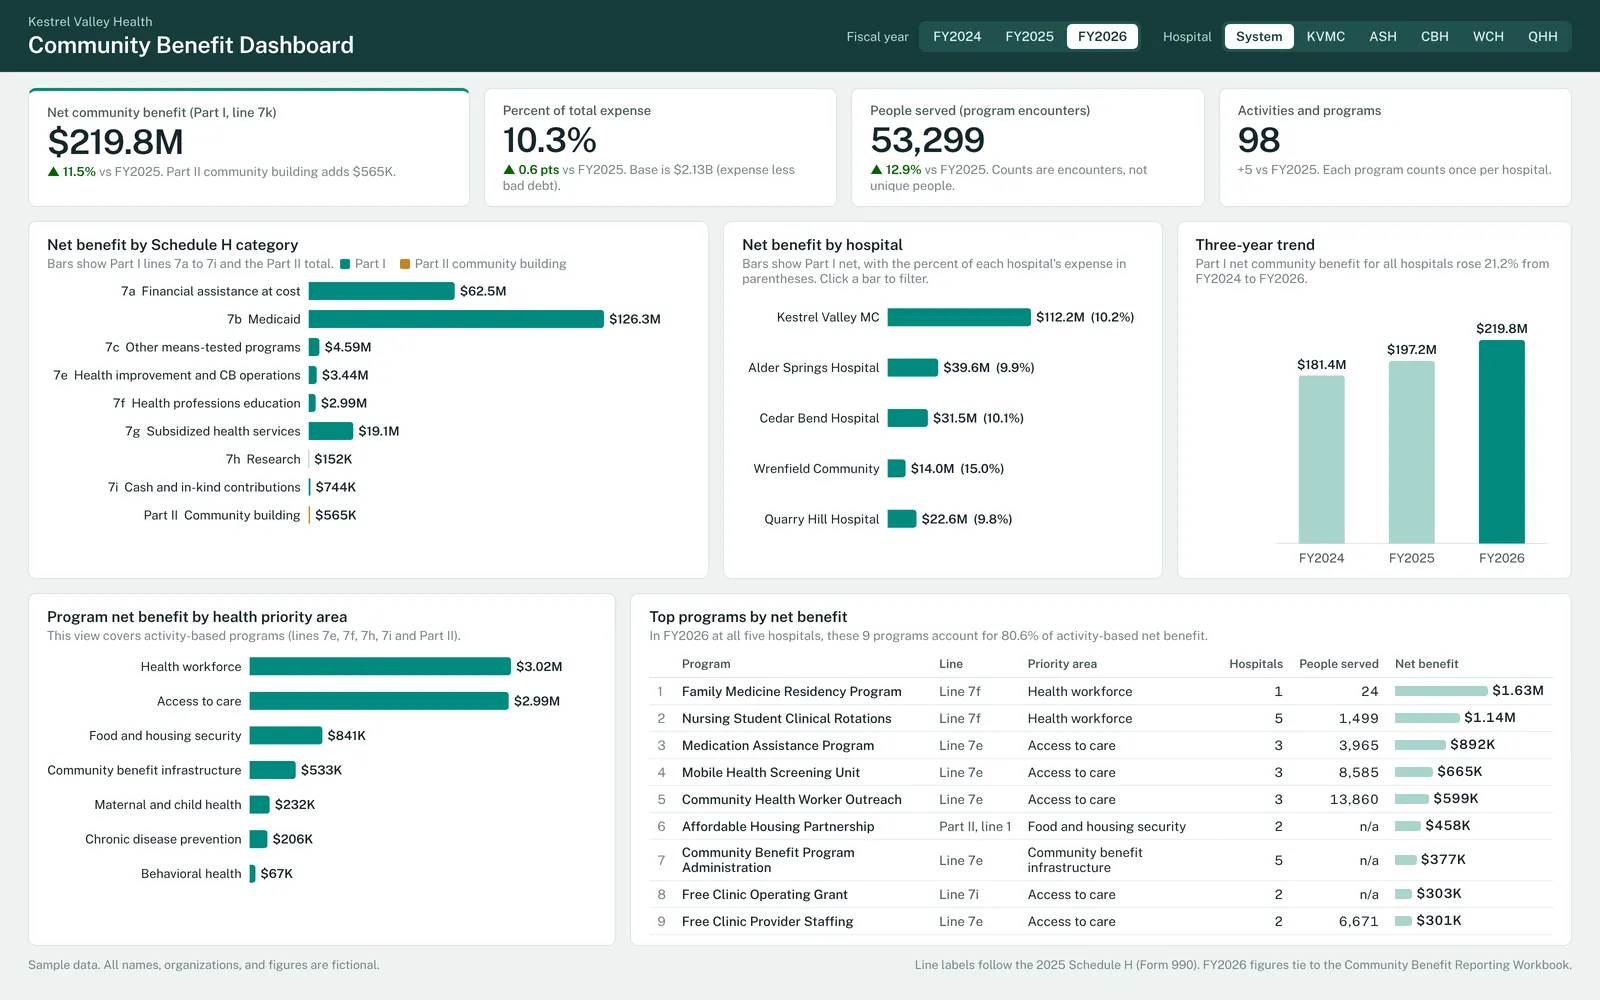
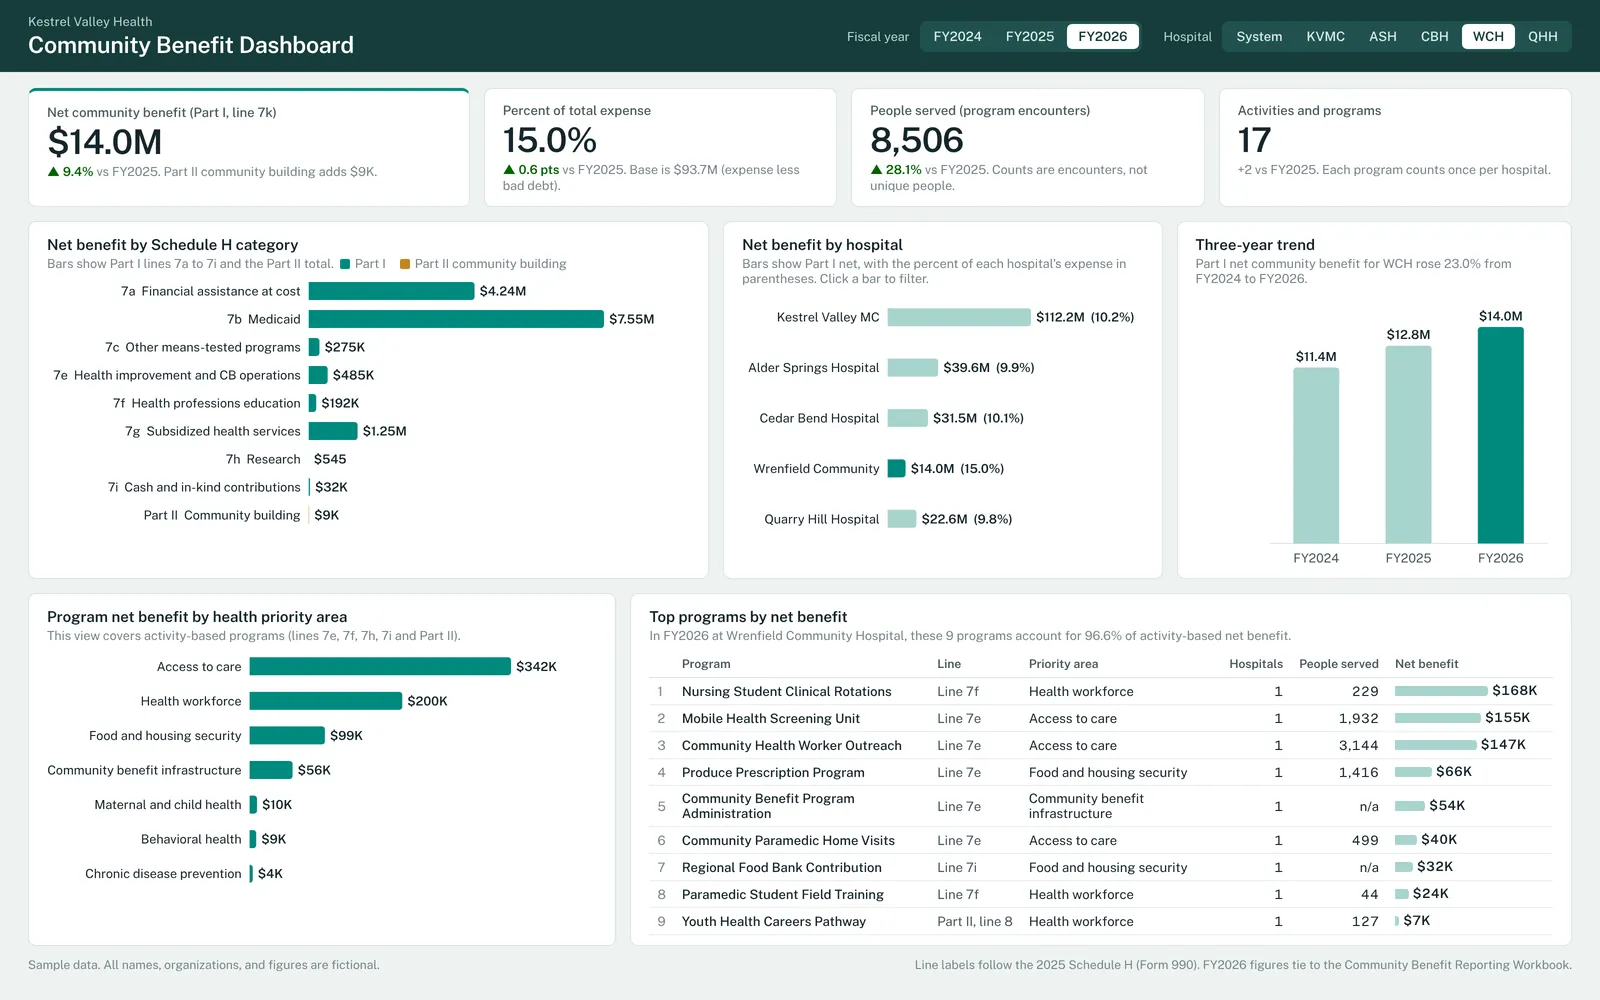
The dashboard shows net community benefit, percent of total expense, people served, and the number of programs, then breaks net benefit down by Schedule H category, by hospital, and by community health priority area, with a three-year trend and a table of the top programs. A hospital selector and a fiscal year selector filter every view, and the FY2026 figures match the workbook's summary sheet.

It is designed for a community benefit or finance team that wants to see where its benefit comes from and how each hospital compares. The rebuild kit includes the data as Excel and CSV tables in a star schema, a theme file, and a step-by-step guide that covers relationships, measures, and visuals.

What it includes

  • A working Power BI report with four pages, nine related tables, and the Schedule H measures, built in Power BI Desktop.
  • KPI cards show net community benefit, percent of total expense, people served, and programs.
  • Bar charts break net benefit down by Schedule H category, hospital, and health priority area.
  • A three-year trend and a top programs table sit beside the breakdowns.
  • Hospital and fiscal year selectors filter every view.
  • The data comes as star-schema tables in Excel and CSV.
  • A Power BI theme file and a rebuild guide with every DAX measure written out are included.

Screenshots

Select an image to see it larger.

More in Community Health and Hospital Community Benefit

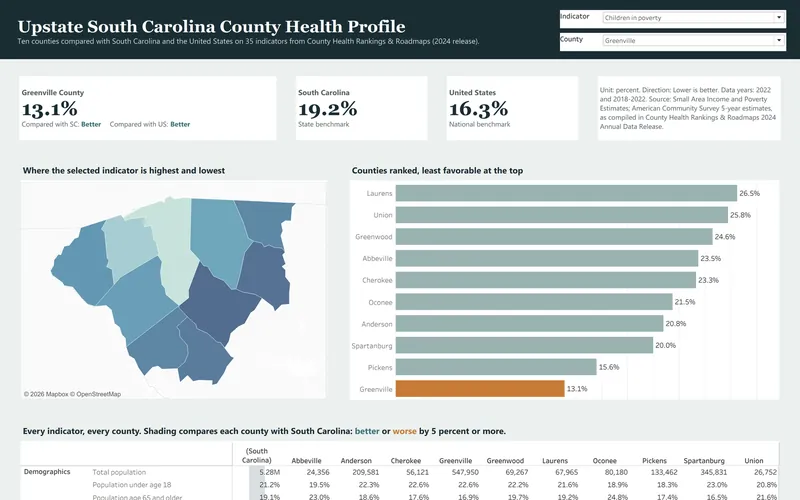
County Health Profile: Upstate South Carolina

This is the secondary data profile from a community health needs assessment for ten Upstate South Carolina counties, and it is built from the 2024 County Health Rankings release. It compares 35 county indicators with state and national values and turns them into a dashboard, a 14-page report and an Excel workbook.

  • Excel
  • Tableau
  • PDF report

Public data

Community Health Survey Results

This sample analyzes a fictional county community health survey with 1,412 respondents, which is the kind of survey hospitals run as part of a community health needs assessment. It includes a filterable dashboard, an 8-page results brief and an Excel workbook with crosstabs, a codebook and weighting.

  • Excel
  • Power BI
  • PDF report

Sample data