Dashboards and Business Intelligence

Referral Partner Sales Dashboard

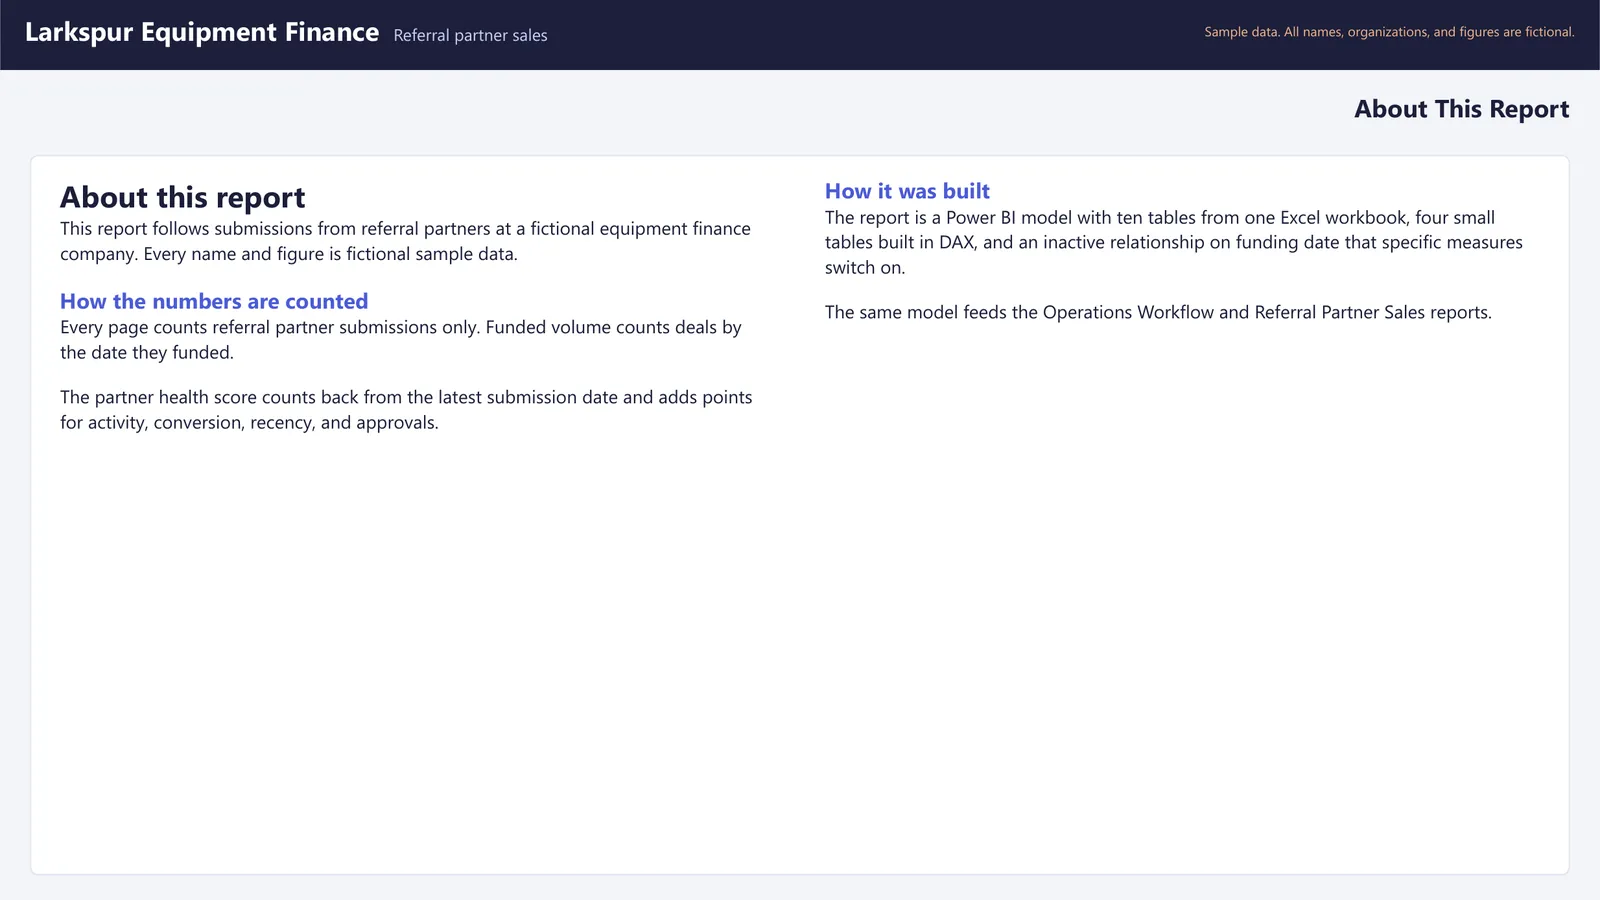
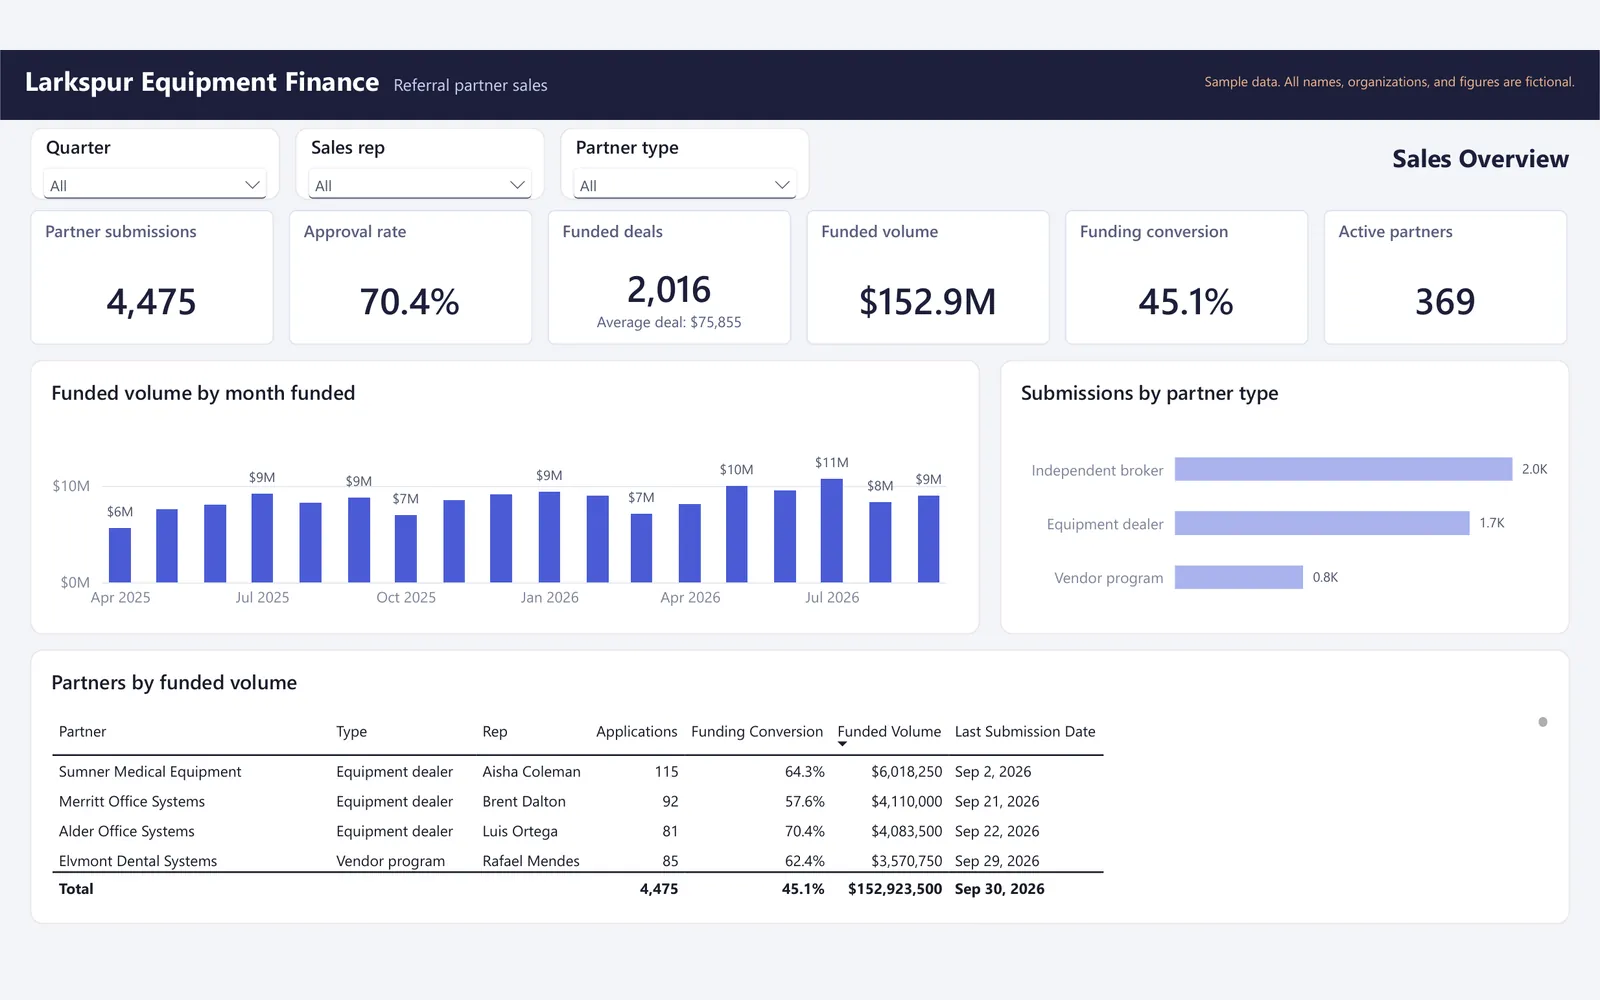
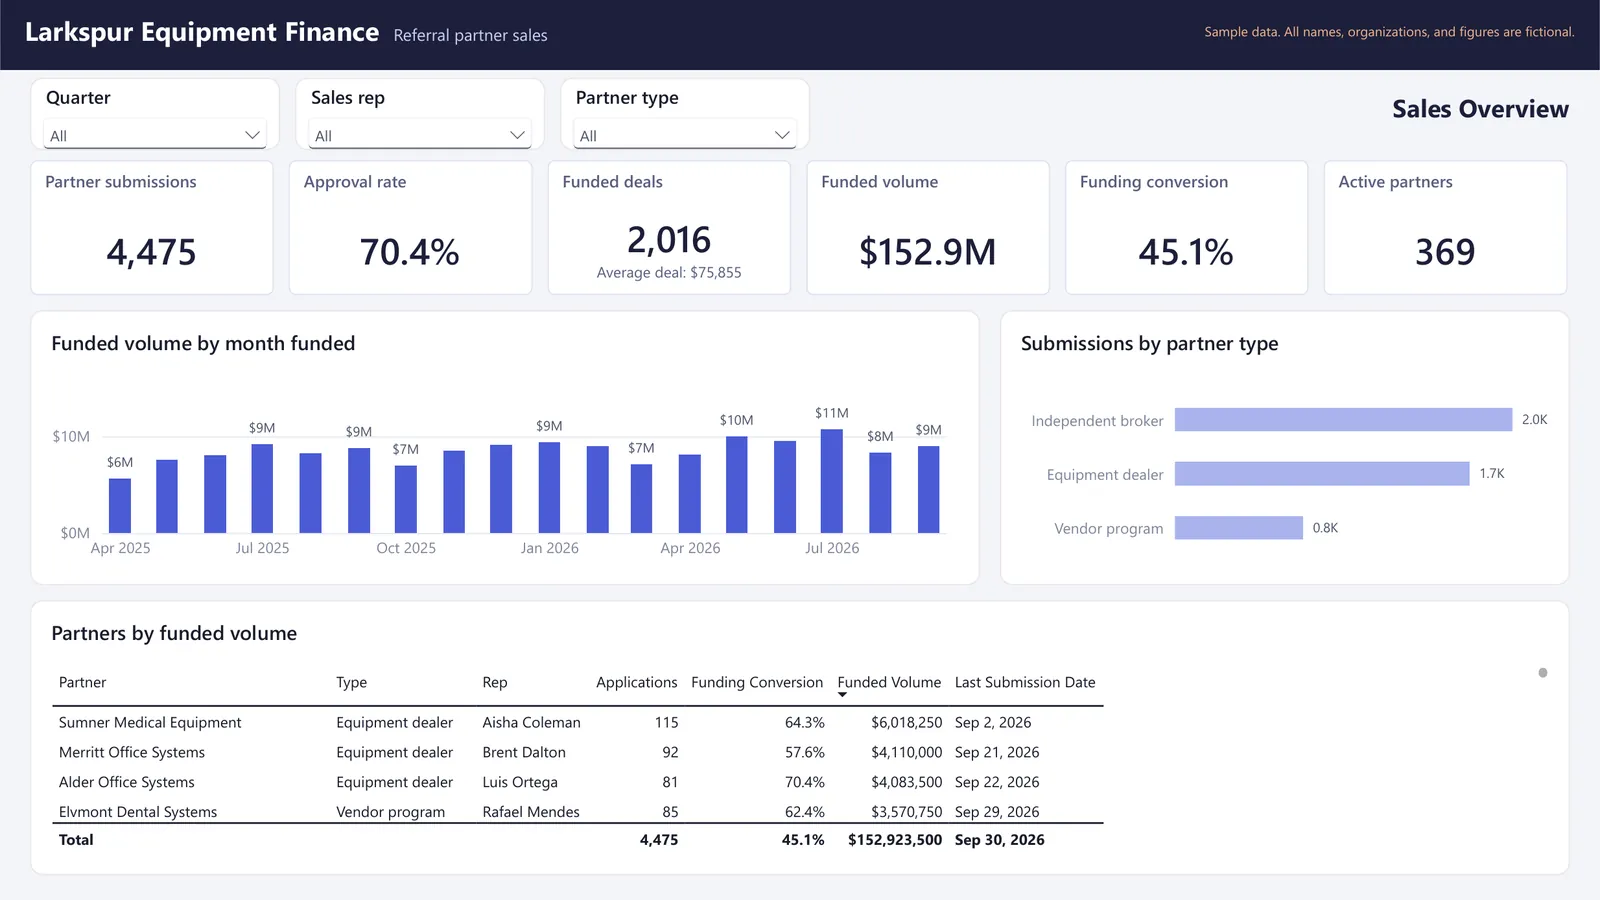
This is a six-page sales dashboard for a fictional equipment finance company that gets most of its business through about 400 referral partners and 10 sales reps. It tracks submissions, approvals, and funding, scores the health of each established partner, and prints a weekly outreach list for each rep.

Sample data. All names, organizations, and figures are fictional.

Referral Partner Sales Dashboard: Powerbi overview partner sales dashboardOpen larger image

About this sample

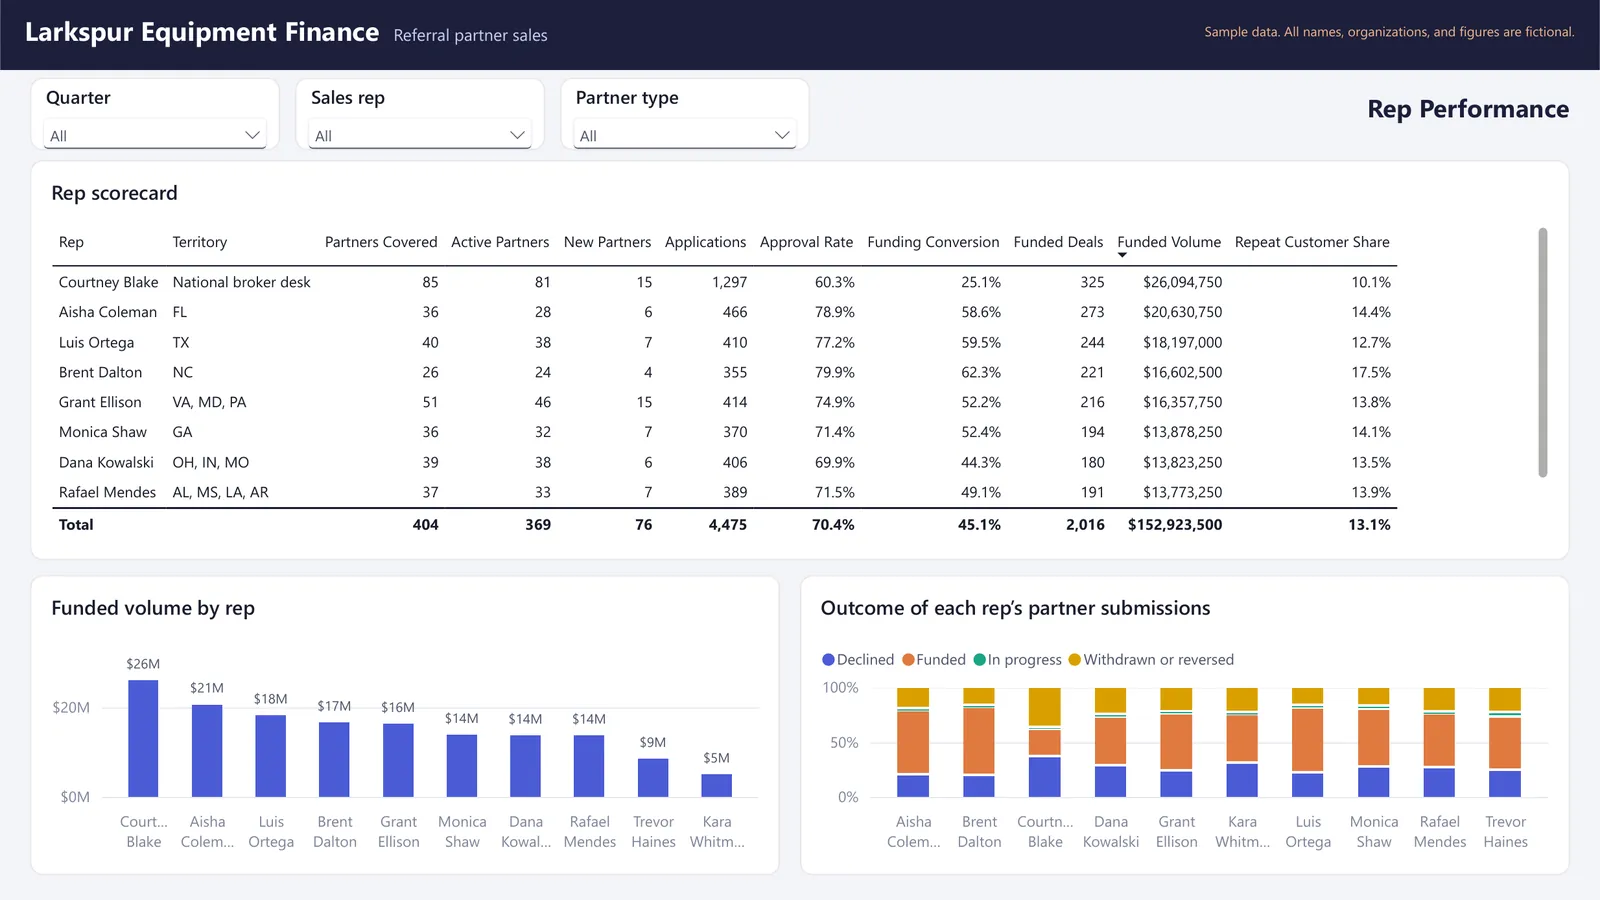
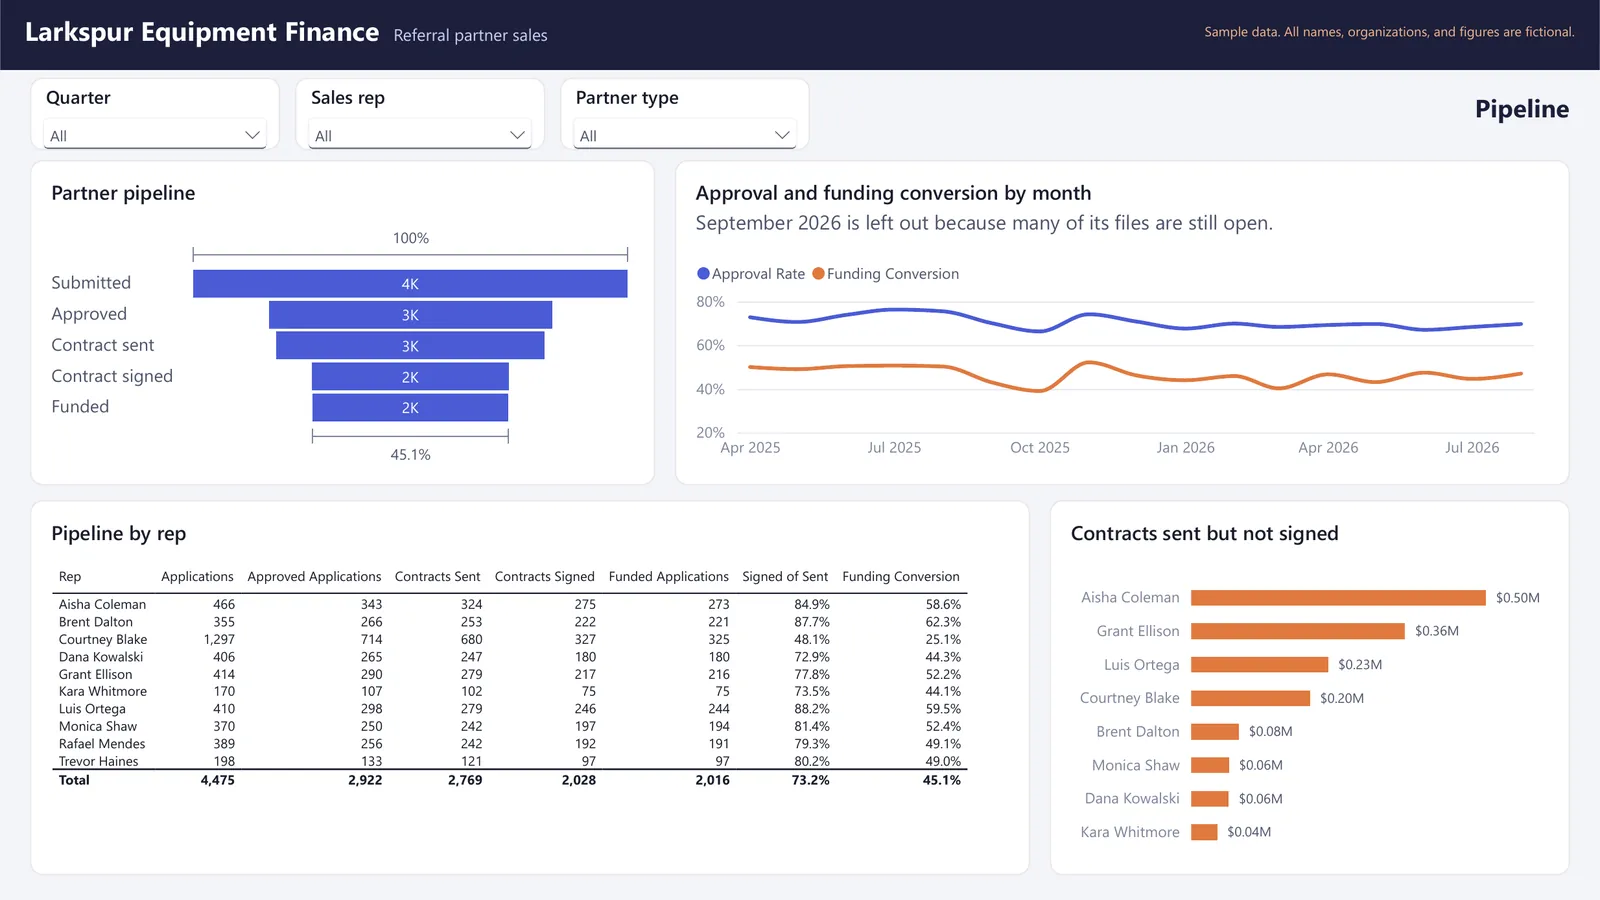
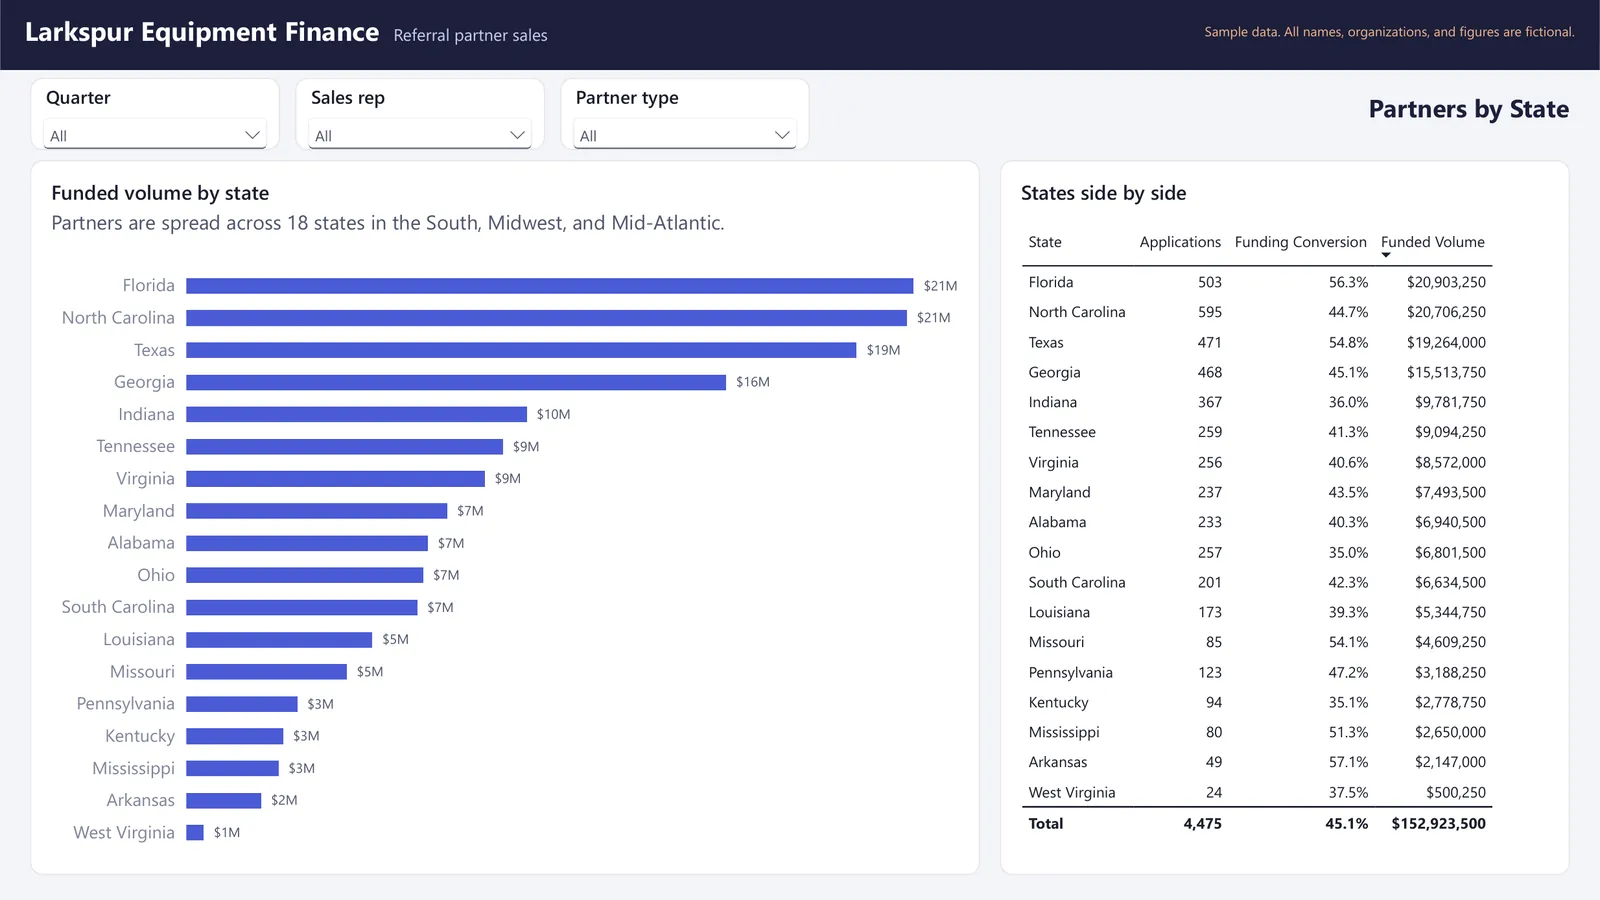
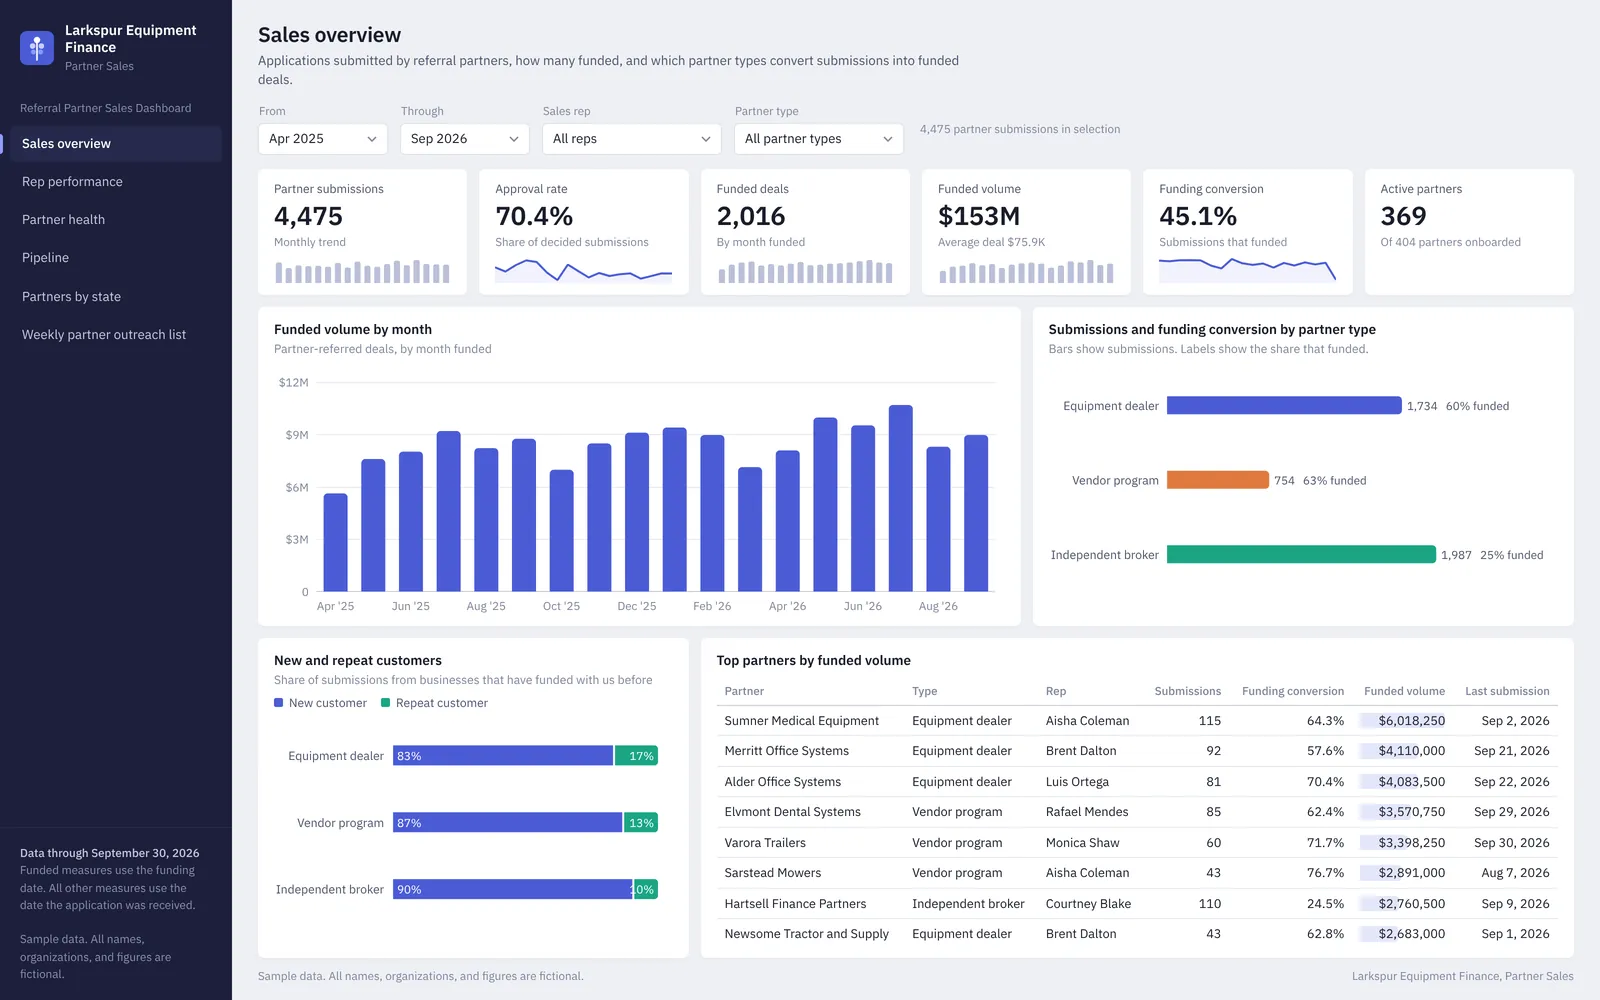
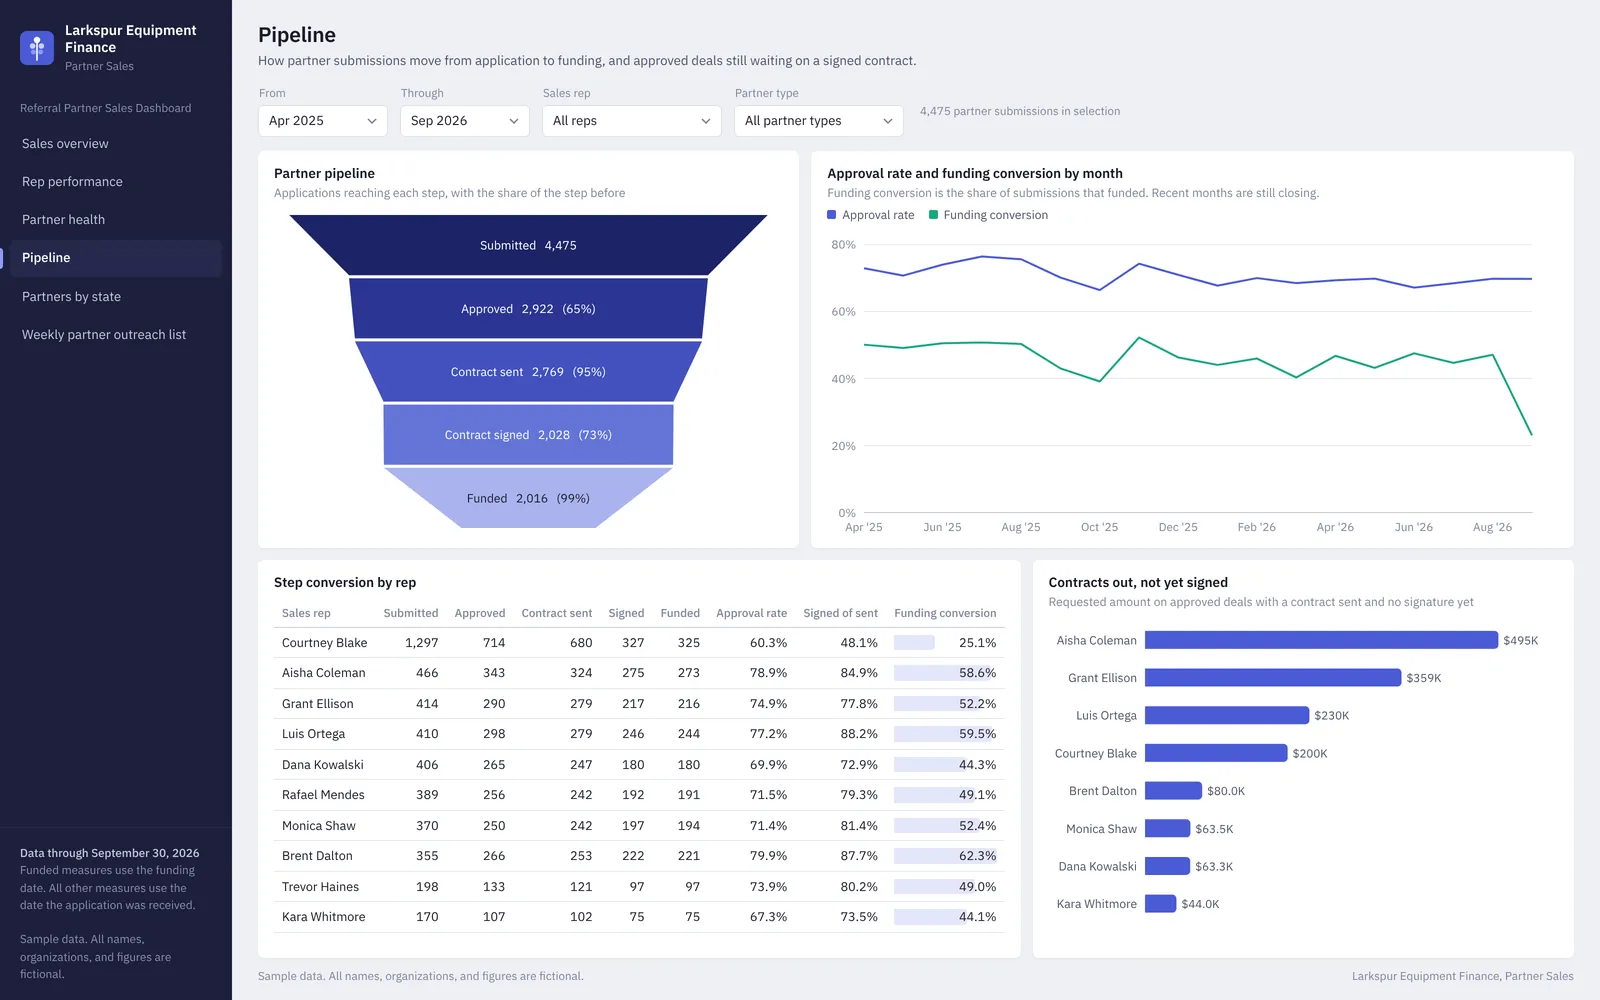
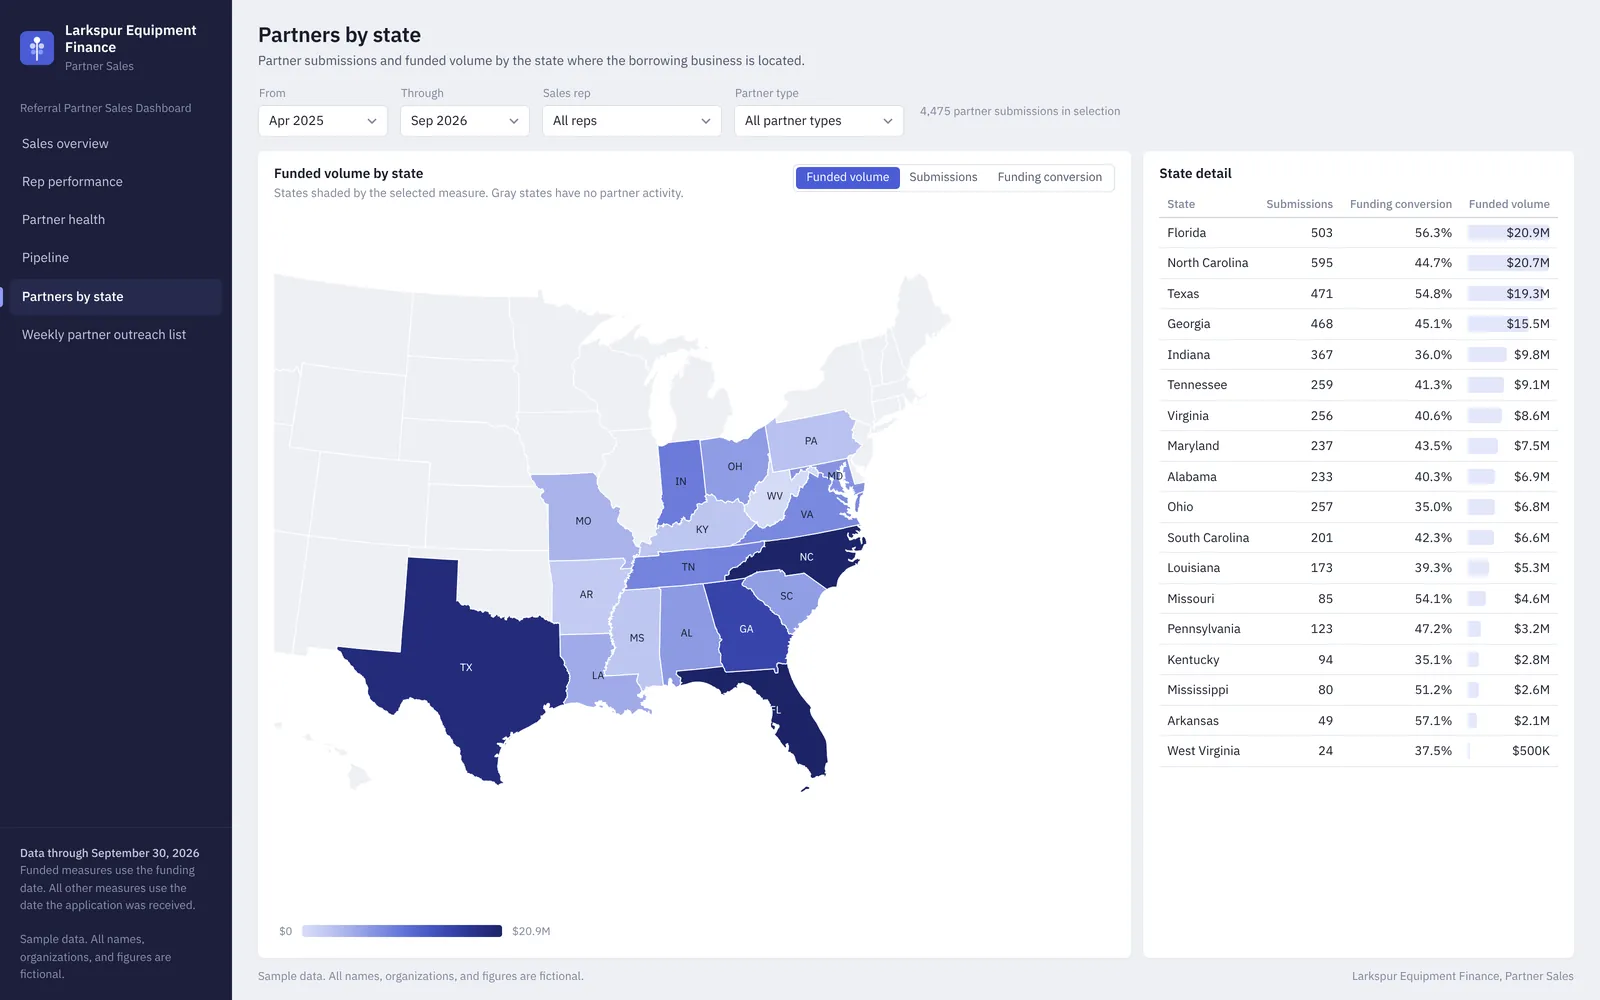
This dashboard is for a sales manager and the reps who cover dealers, vendor programs, and brokers. It shows funded volume by month, submissions and funding conversion by partner type, new and repeat customers, a rep scorecard, a pipeline funnel from submission to funding, and a comparison of funded volume by state.

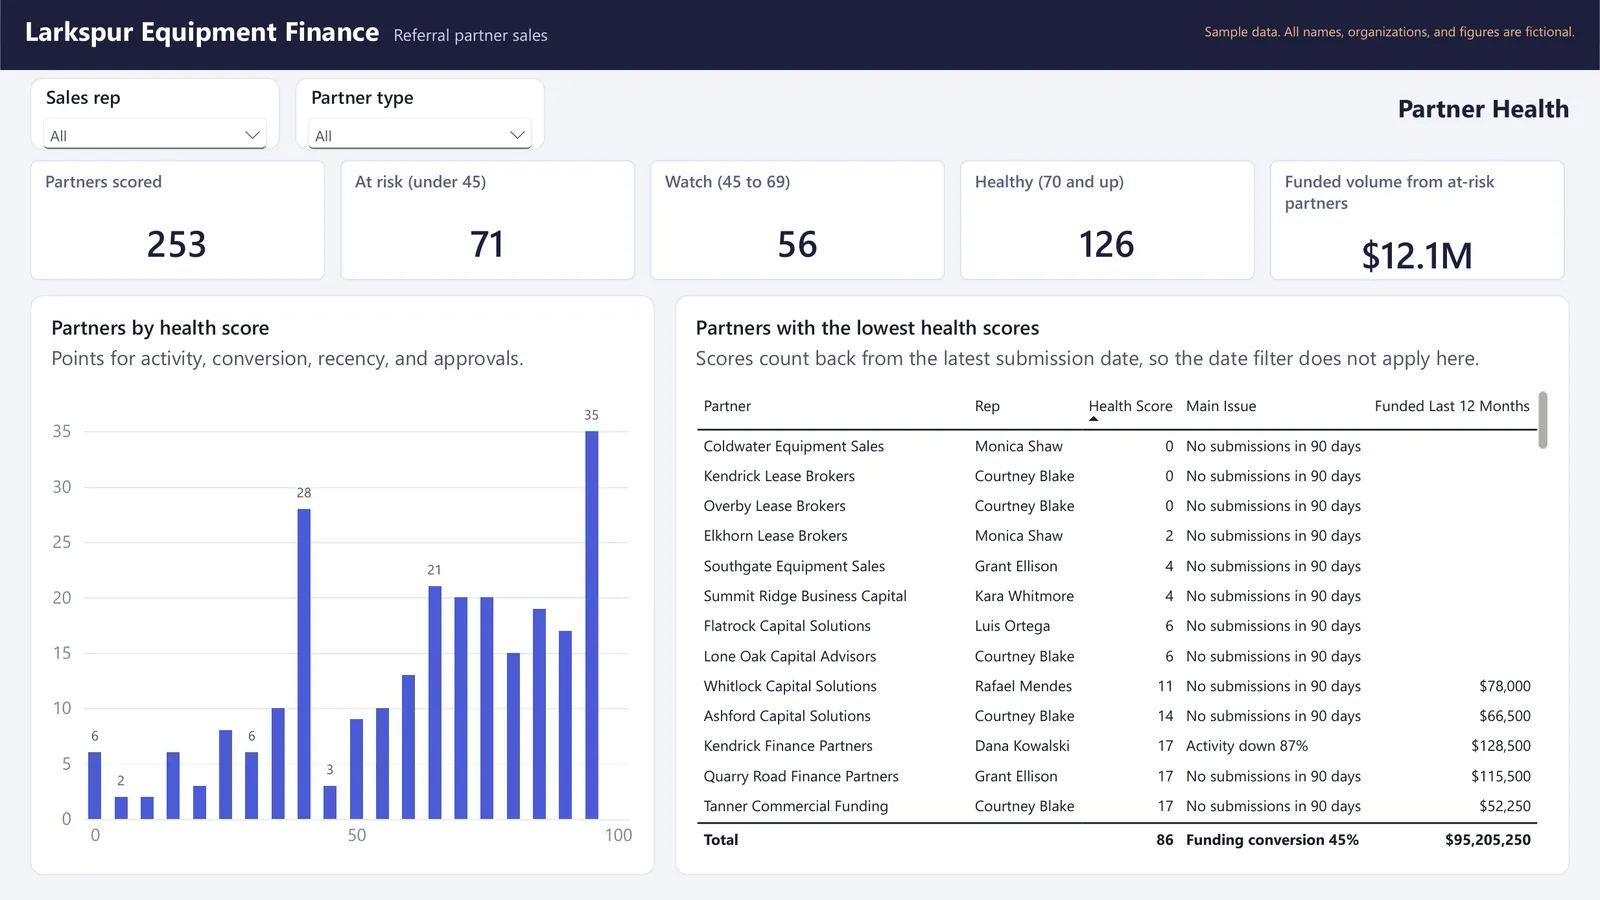
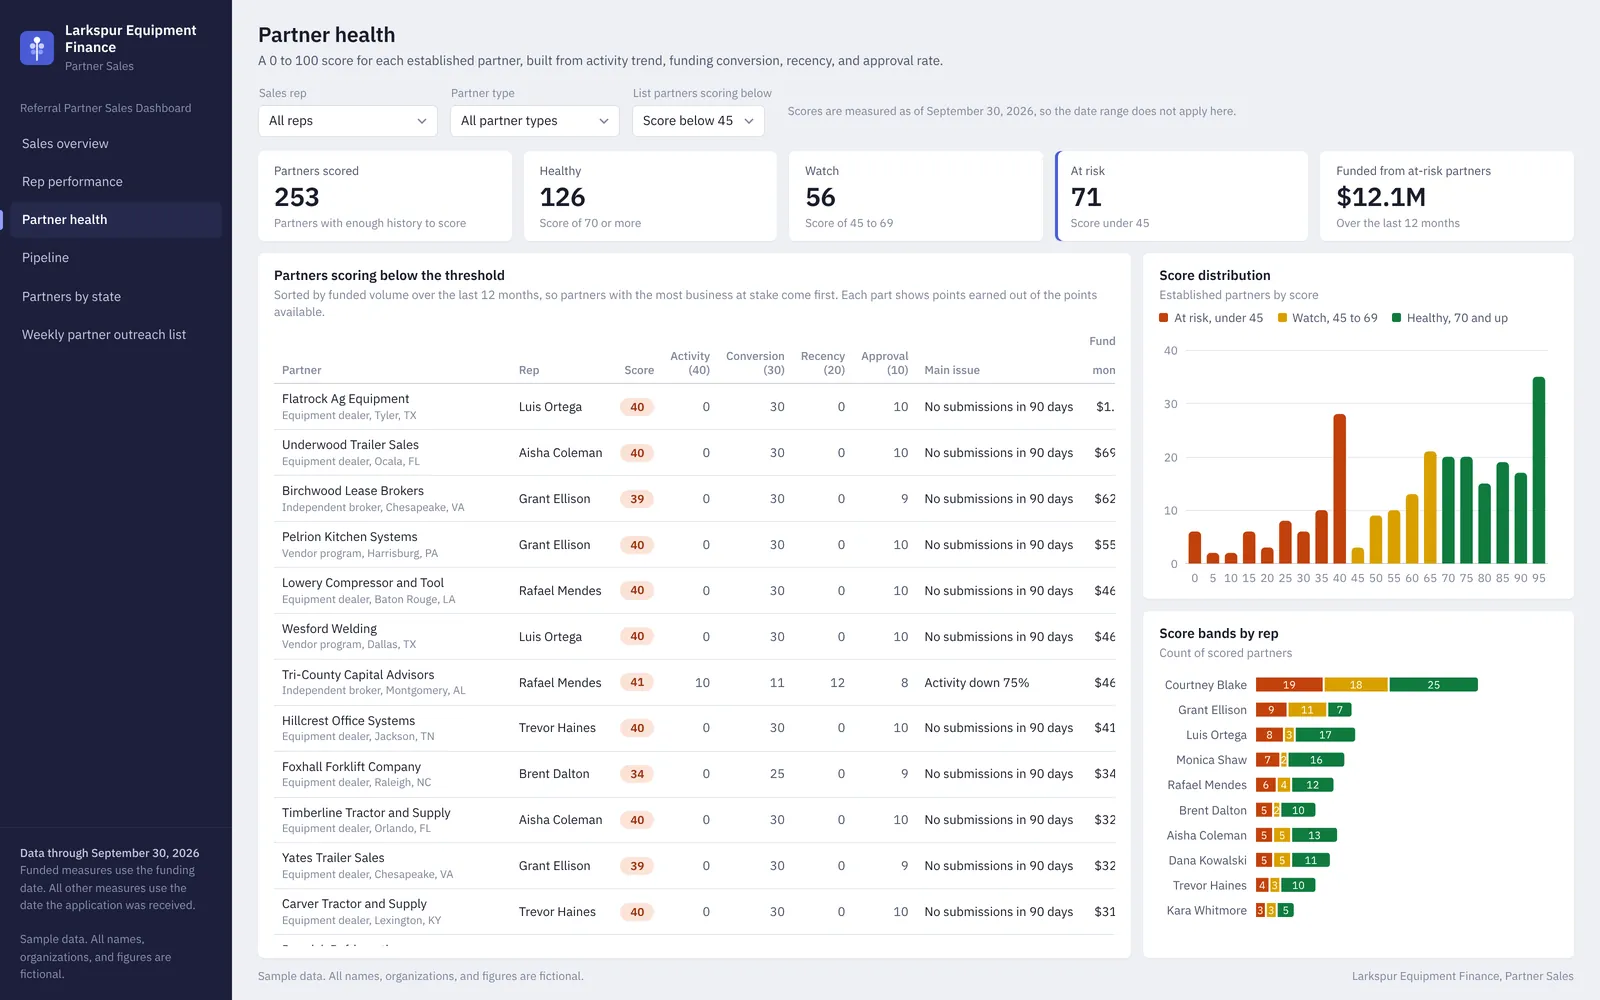
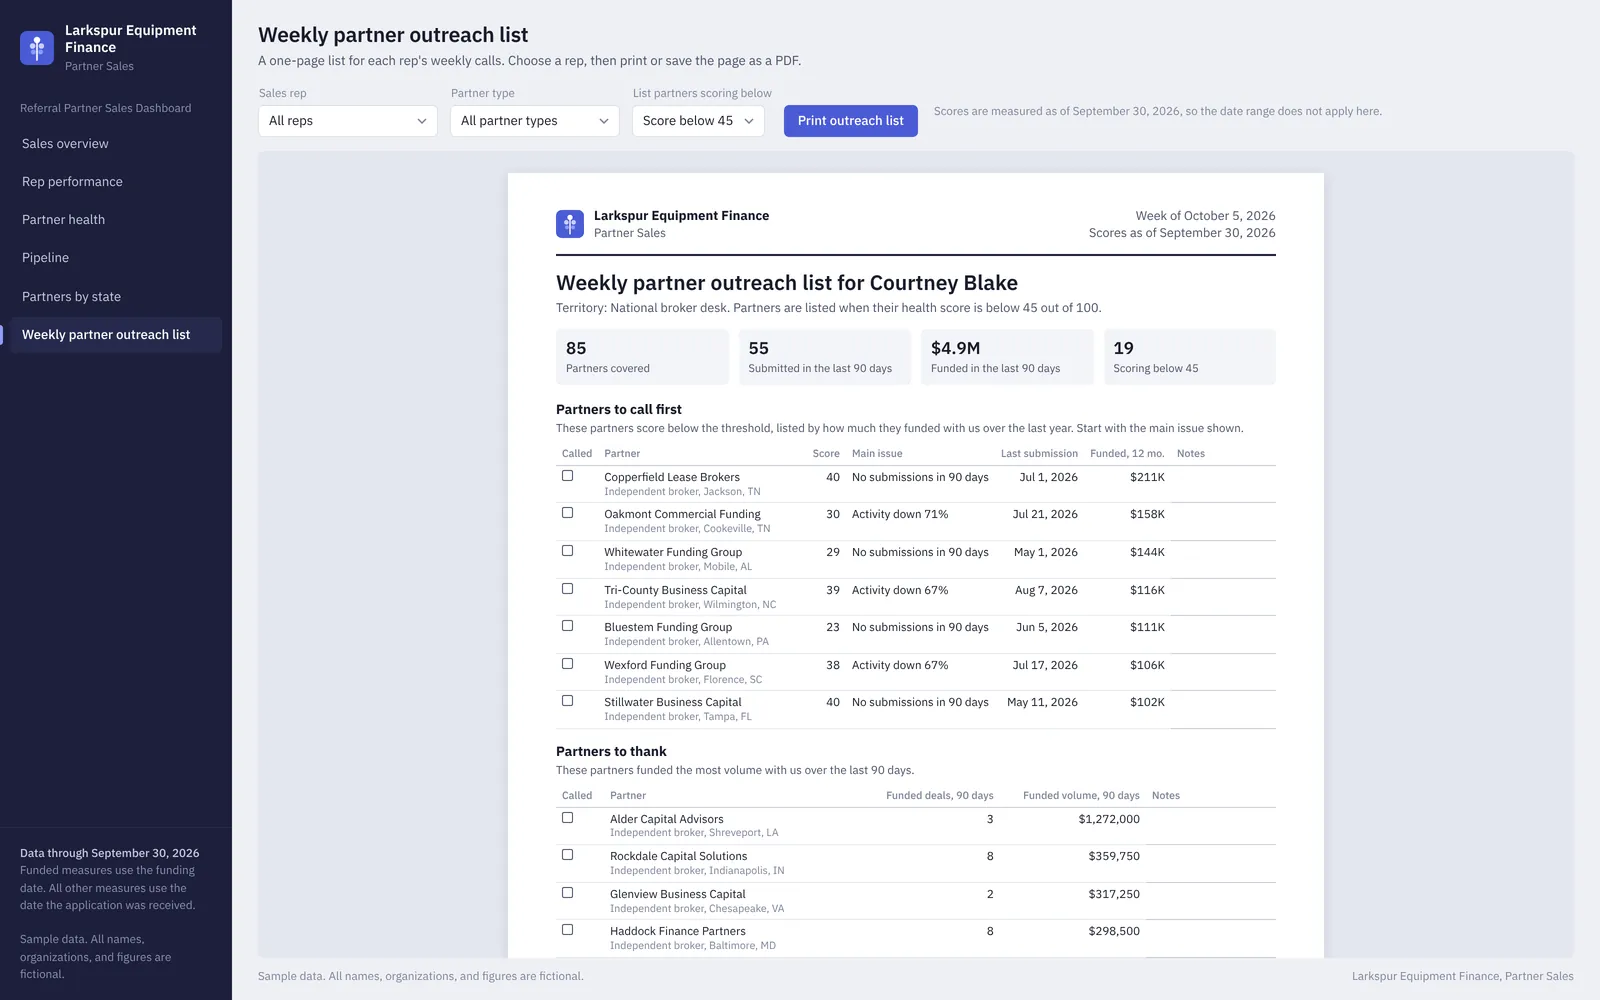
The Partner health page gives each established partner a score from 0 to 100 built from four parts: activity compared with the partner's usual pace, funding conversion, how recently the partner submitted, and approval rate. The page lists partners below an adjustable threshold with the part that cost them the most points. The Weekly partner outreach list turns that into a printable page for each rep with partners to call first, partners to thank, and new partners to check on. In the sample, independent brokers send the most applications but convert the fewest to funding.
What it includes

  • A working Power BI report with six pages built on the same model as the operations report, built in Power BI Desktop.
  • Six pages with slicers for date range, sales rep, and partner type
  • Partner health score from 0 to 100 with four parts and an adjustable threshold
  • Printable one-page weekly partner outreach list for each rep
  • Submissions and funding conversion by partner type
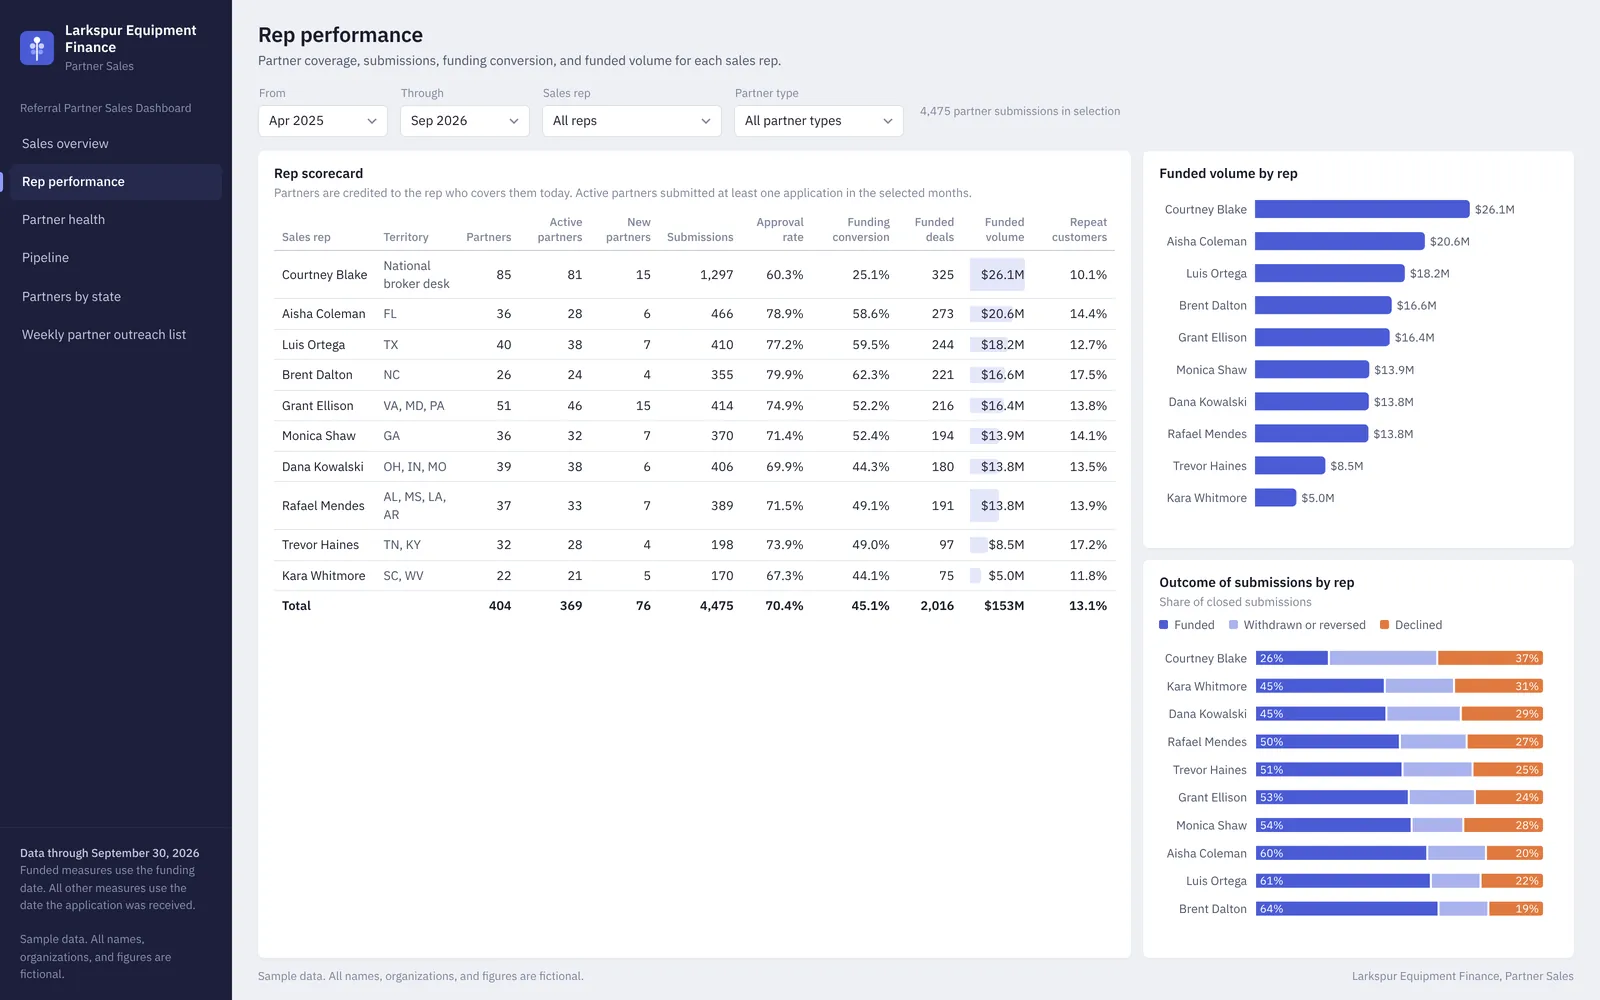
  • Rep scorecard covering partners, submissions, approval rate, funding conversion, and funded volume
  • Pipeline funnel from submission to funding and contracts waiting on a signature
  • Rebuild guide with 47 DAX measures, including every part of the health score

Screenshots

Select an image to see it larger.

More in Dashboards and Business Intelligence

County Health Profile: Upstate South Carolina

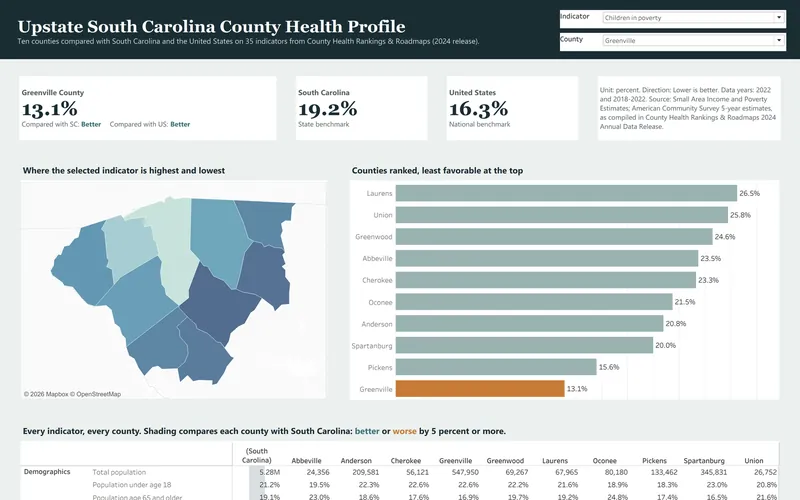
This is the secondary data profile from a community health needs assessment for ten Upstate South Carolina counties, and it is built from the 2024 County Health Rankings release. It compares 35 county indicators with state and national values and turns them into a dashboard, a 14-page report and an Excel workbook.

  • Excel
  • Tableau
  • PDF report

Public data

Community Health Survey Results

This sample analyzes a fictional county community health survey with 1,412 respondents, which is the kind of survey hospitals run as part of a community health needs assessment. It includes a filterable dashboard, an 8-page results brief and an Excel workbook with crosstabs, a codebook and weighting.

  • Excel
  • Power BI
  • PDF report

Sample data