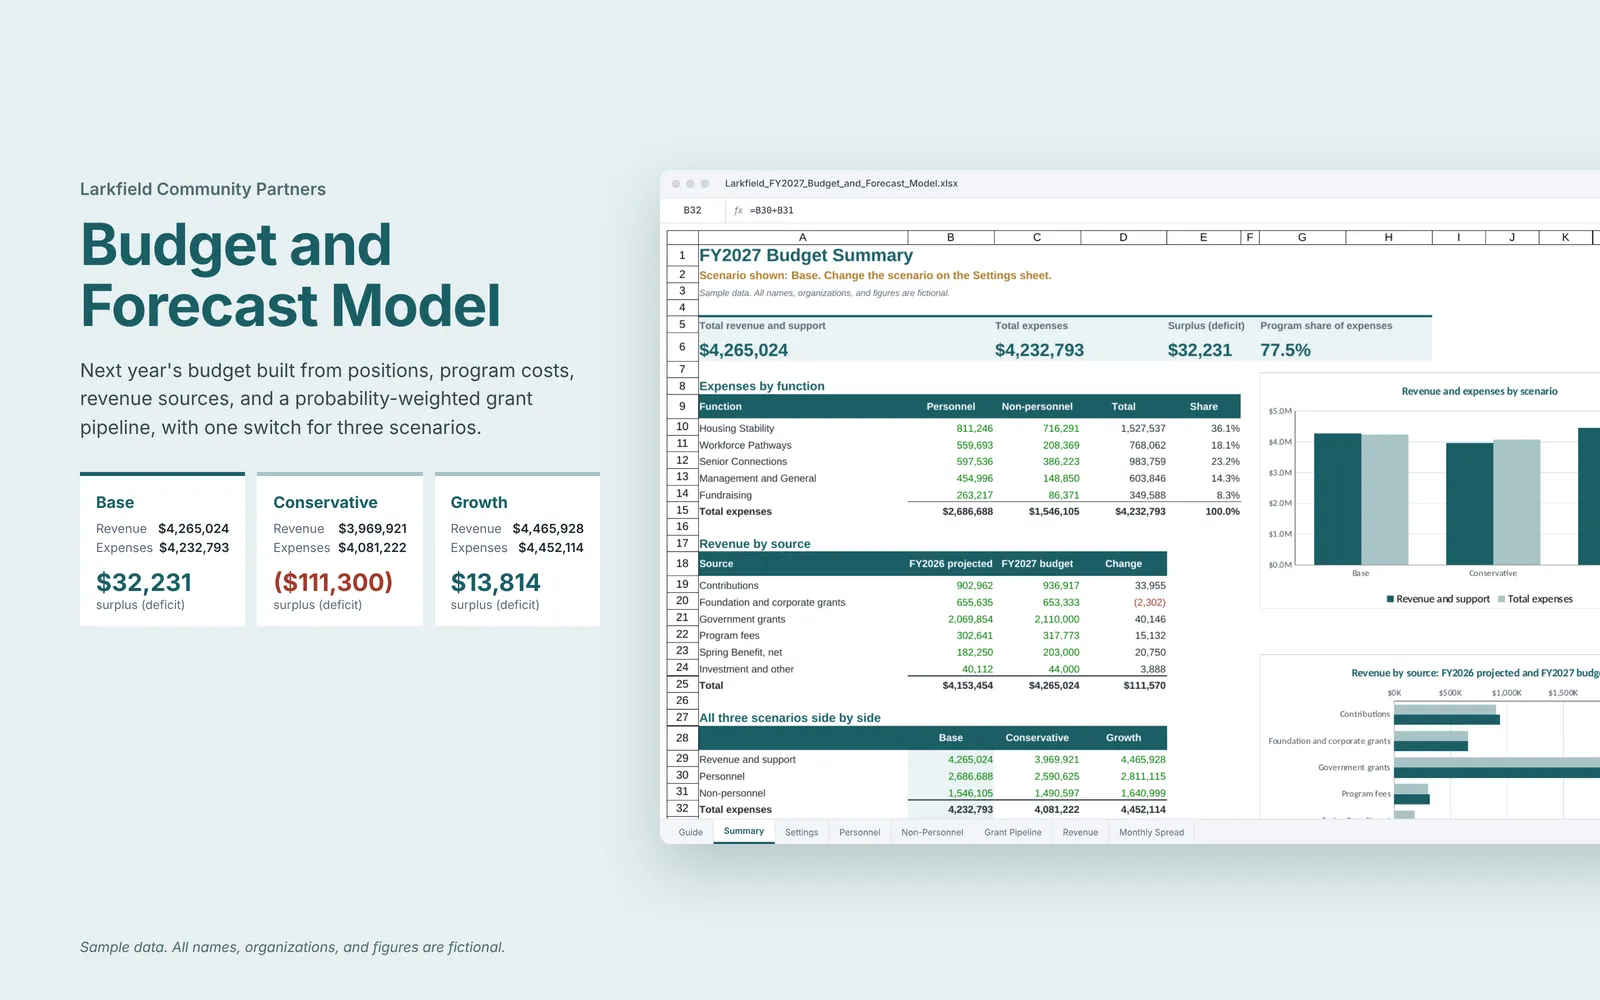
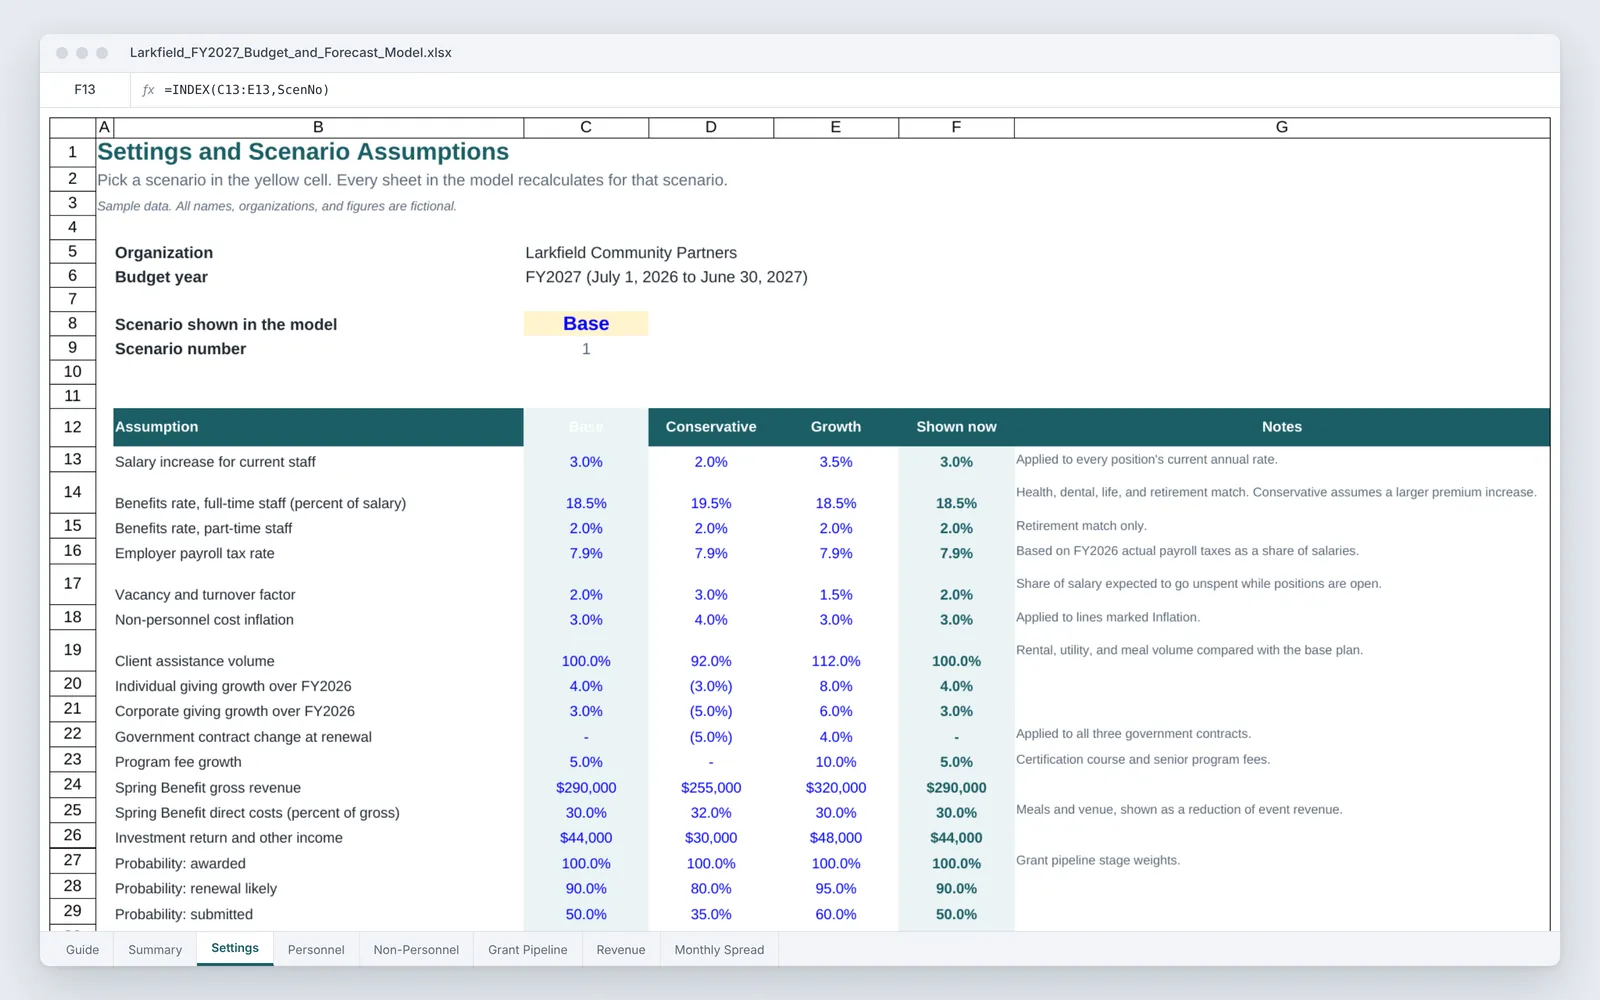
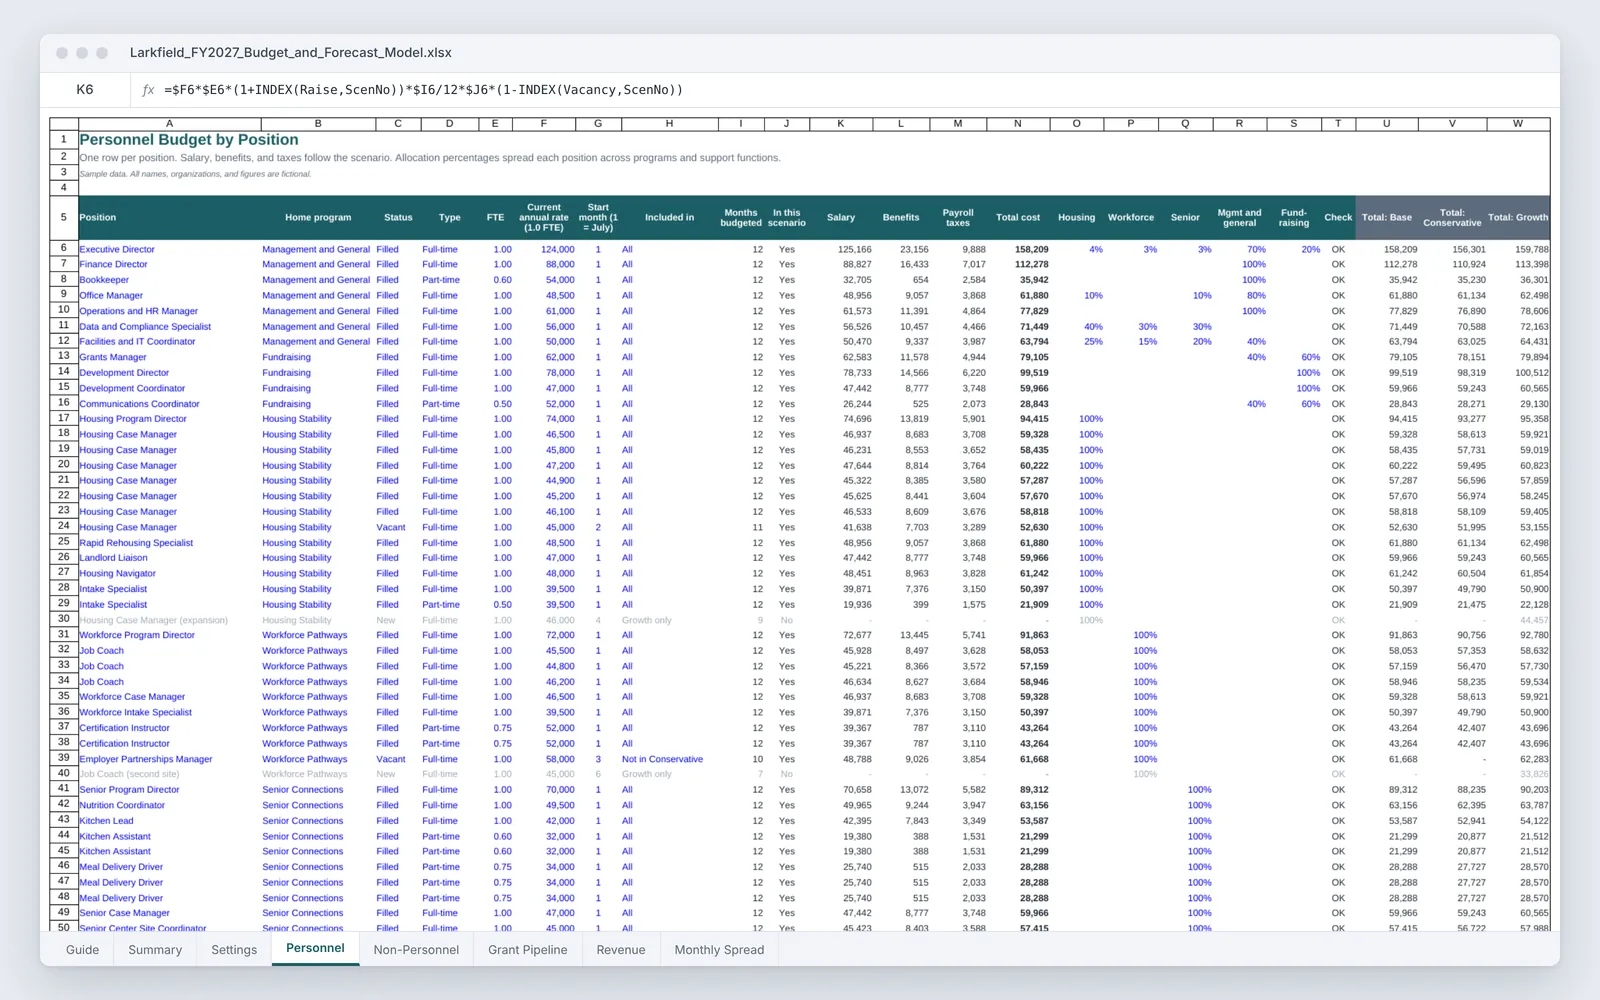
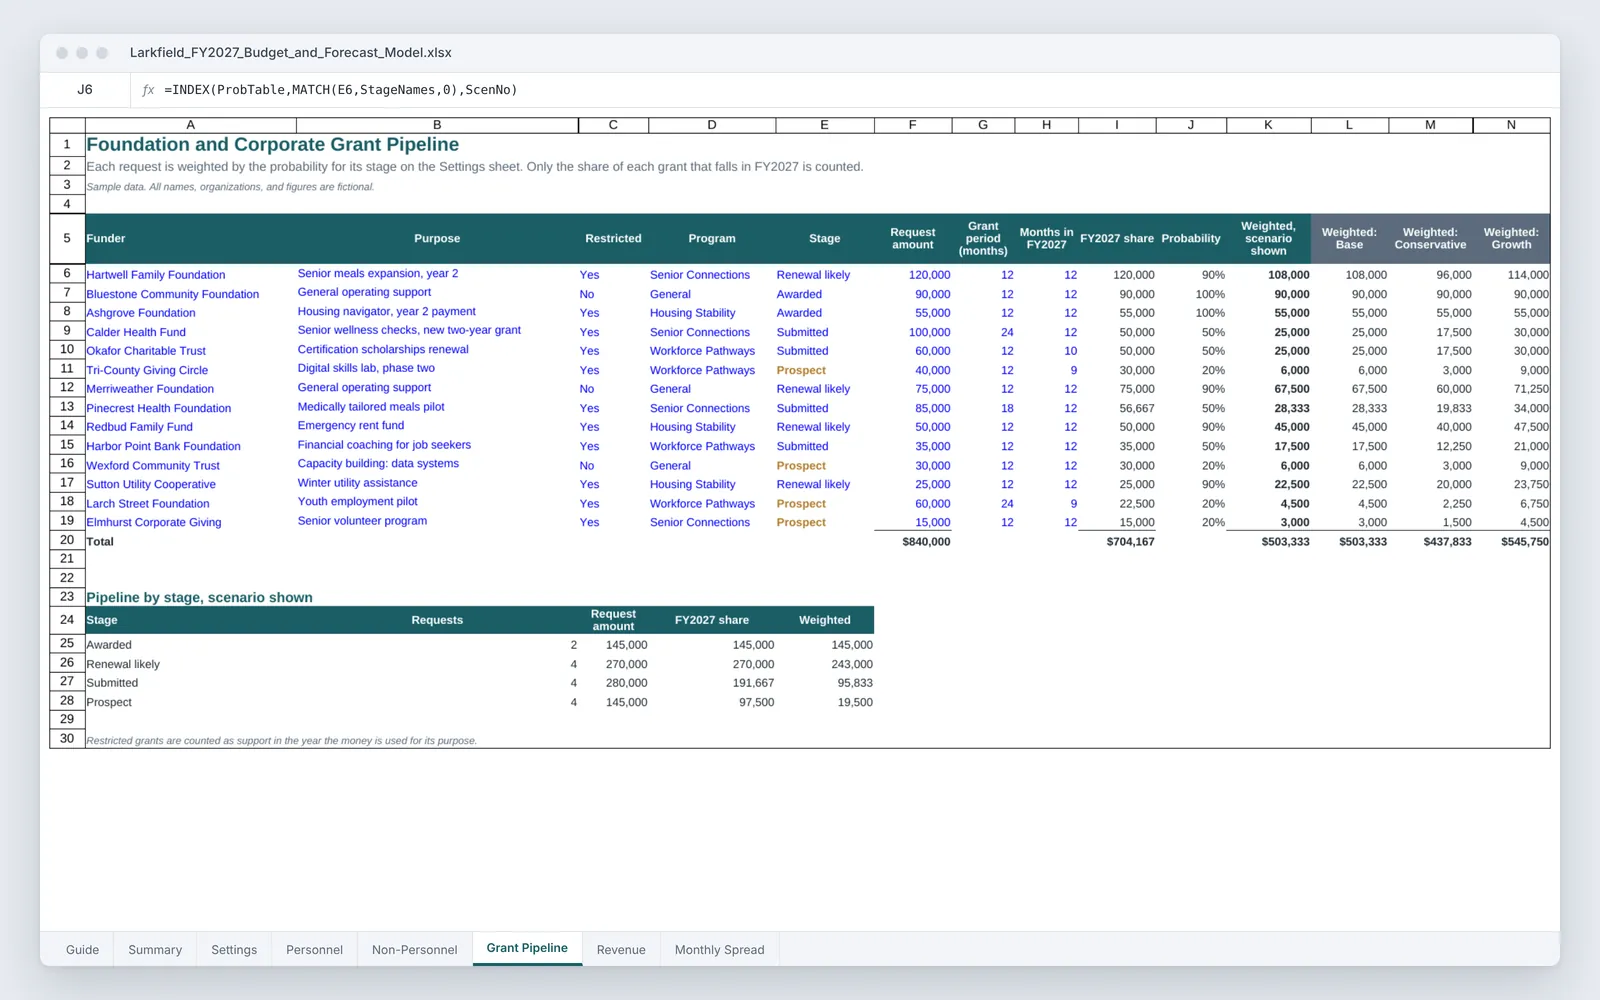
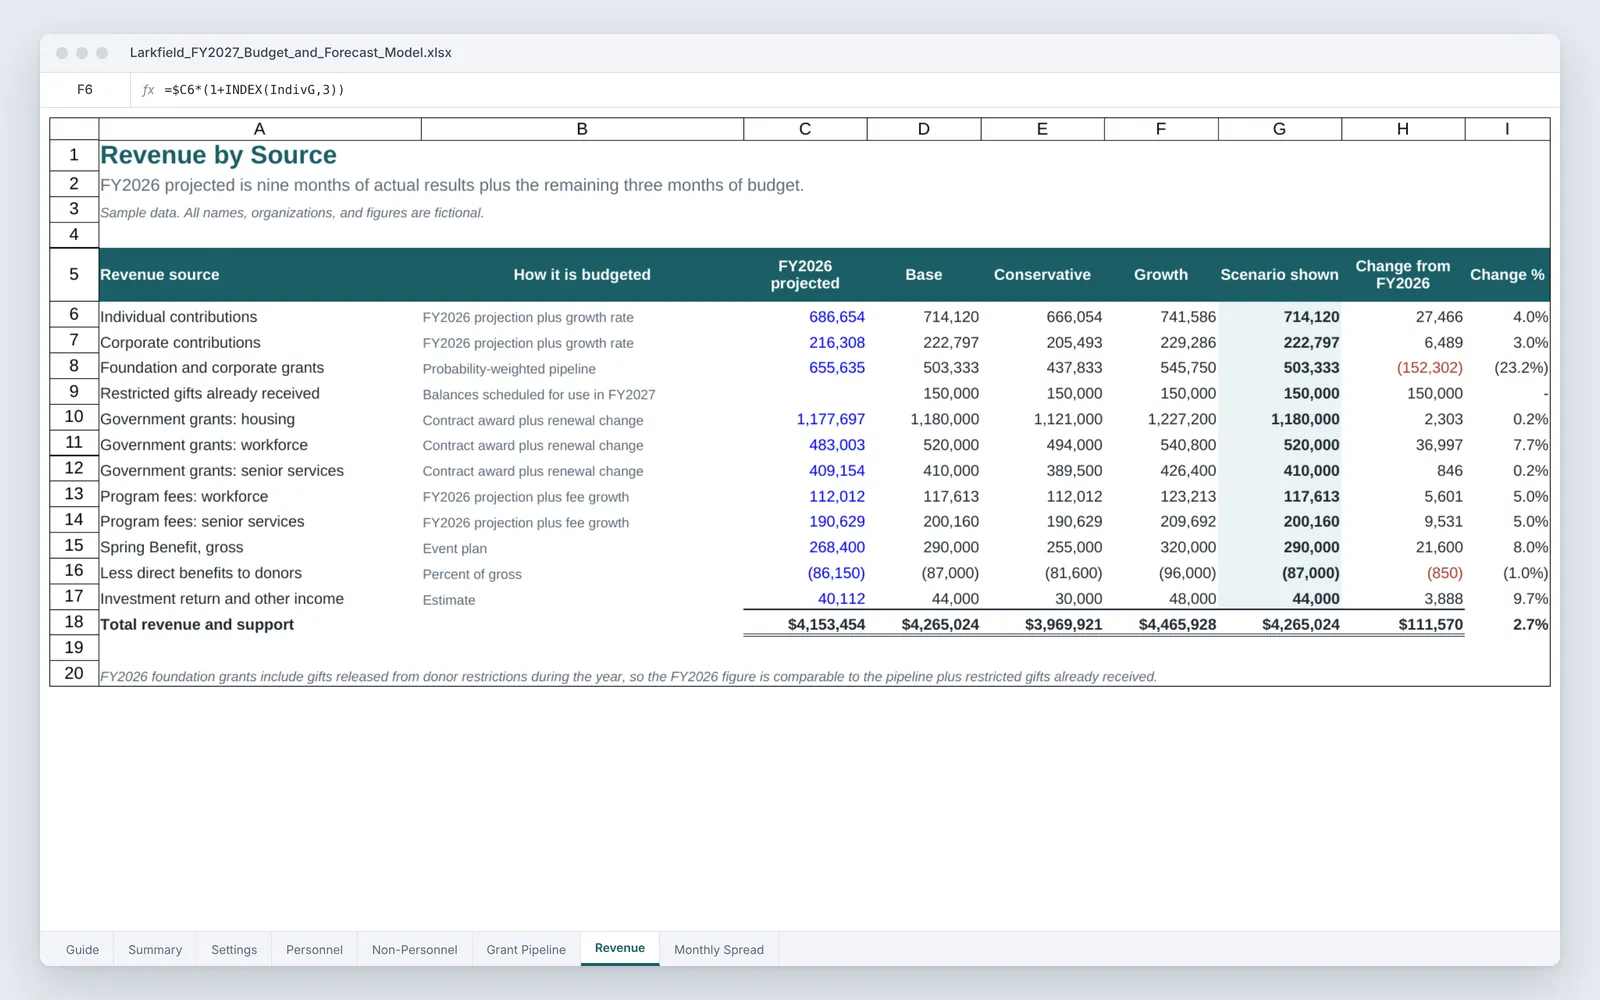
The model starts with a personnel sheet that lists every position with its FTE, current rate, start month, benefits, payroll taxes, and how its cost splits across programs and support functions. Non-personnel costs are entered by program and marked fixed, inflation, or volume, which decides how each line moves between scenarios, and shared costs are spread by FTE. Revenue comes from the current-year projection, government contract awards, the event plan, and a grant pipeline weighted by the probability of each stage.
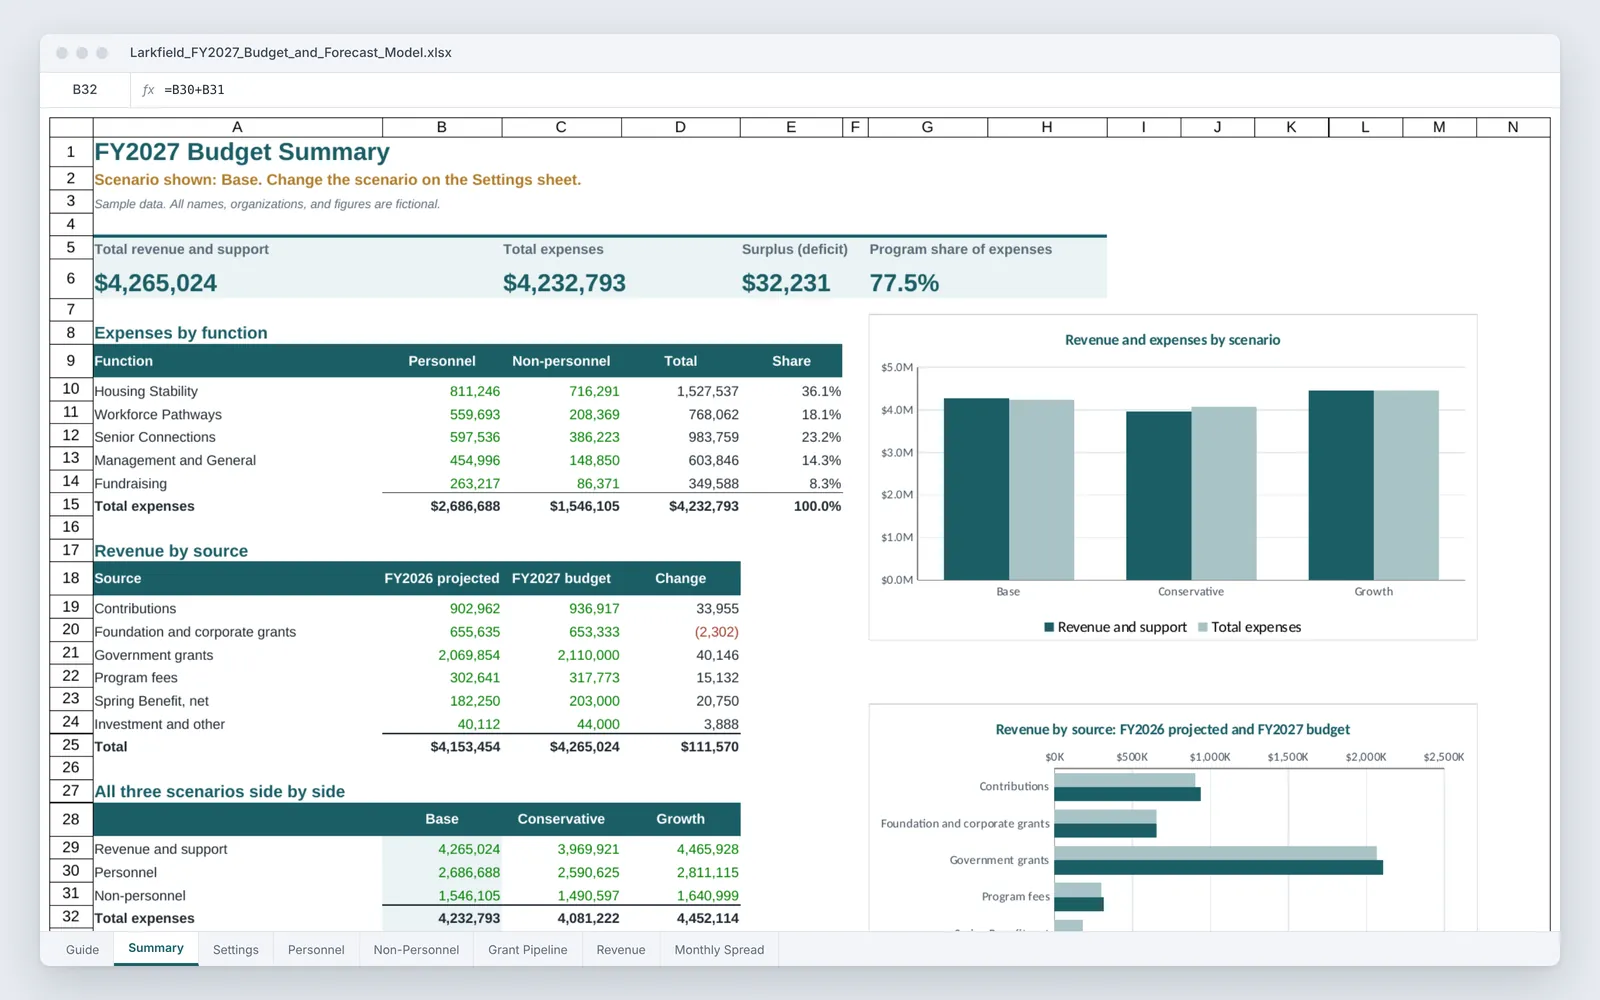
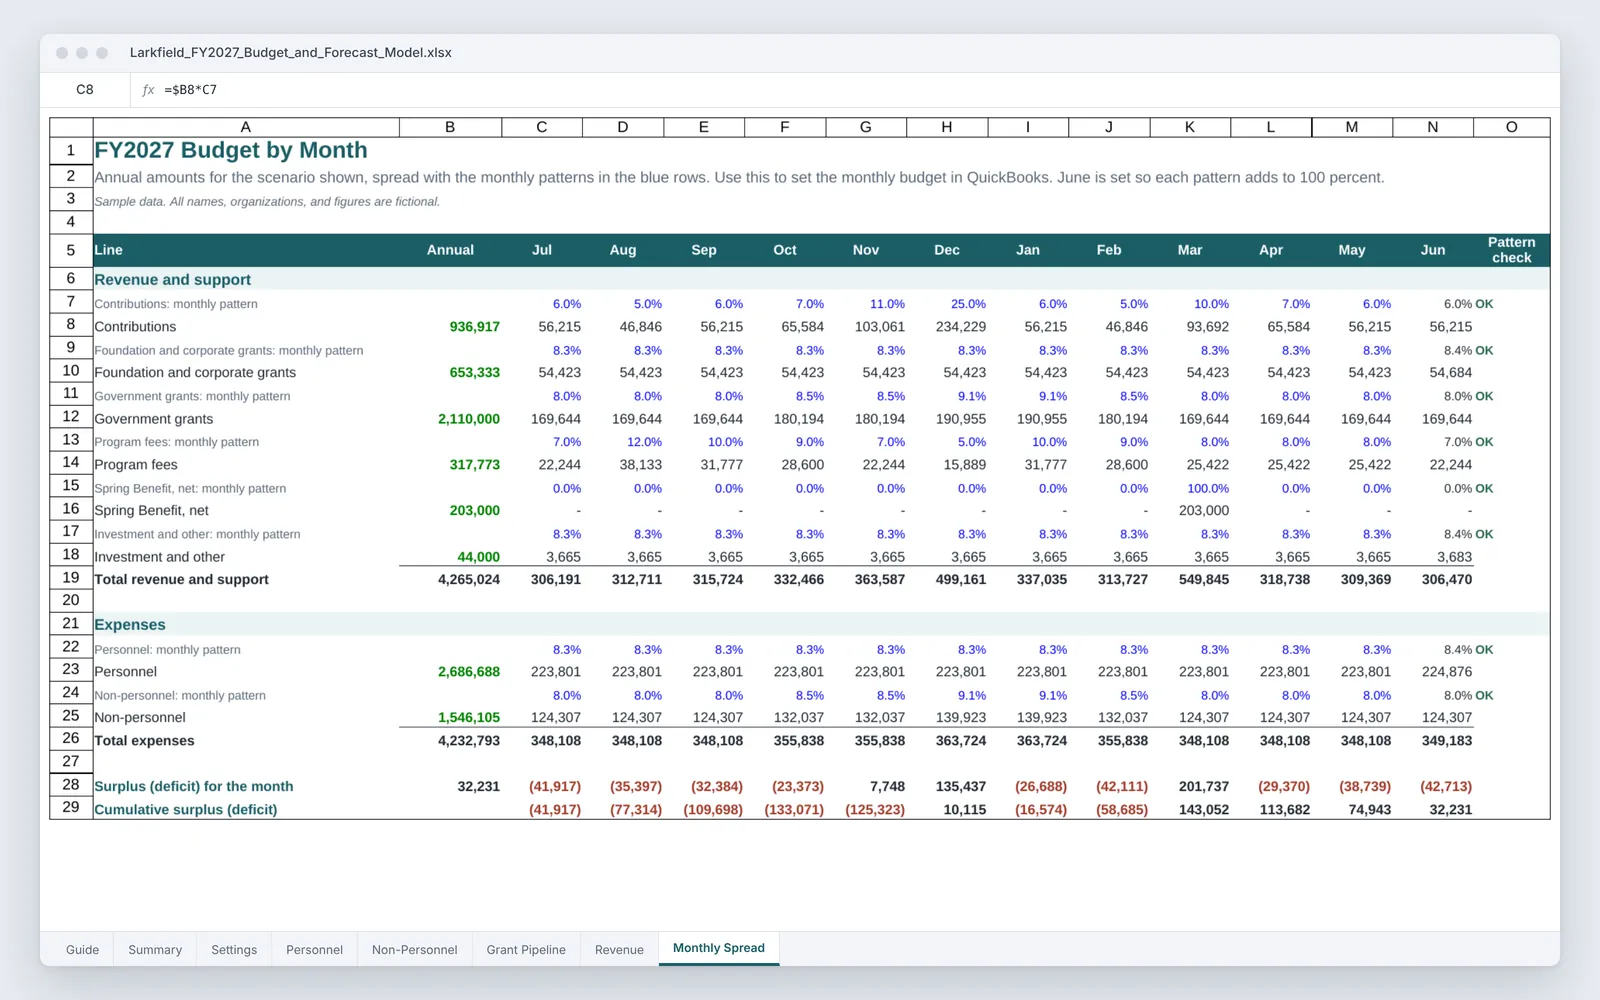
The summary shows the scenario chosen, expenses by function, revenue compared with the current-year projection, and all three scenarios side by side, with native Excel charts. A monthly spread turns the annual budget into the amounts a finance director would load into QuickBooks and shows the months when the budget runs a deficit, which helps with cash planning before the year starts.