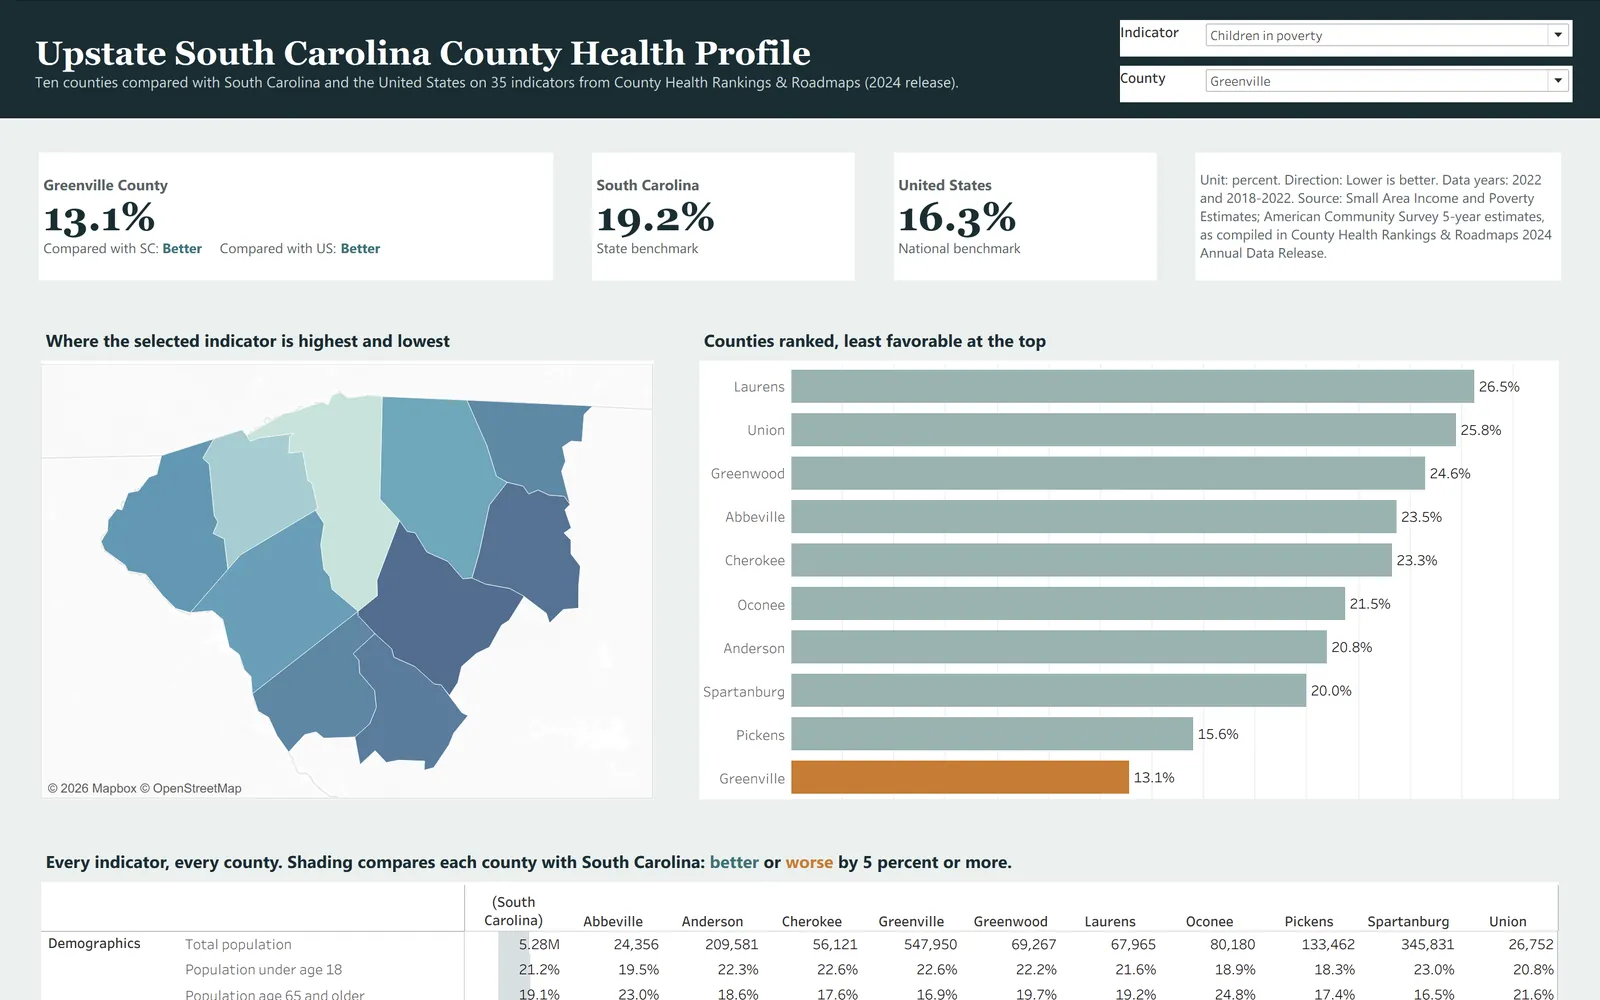
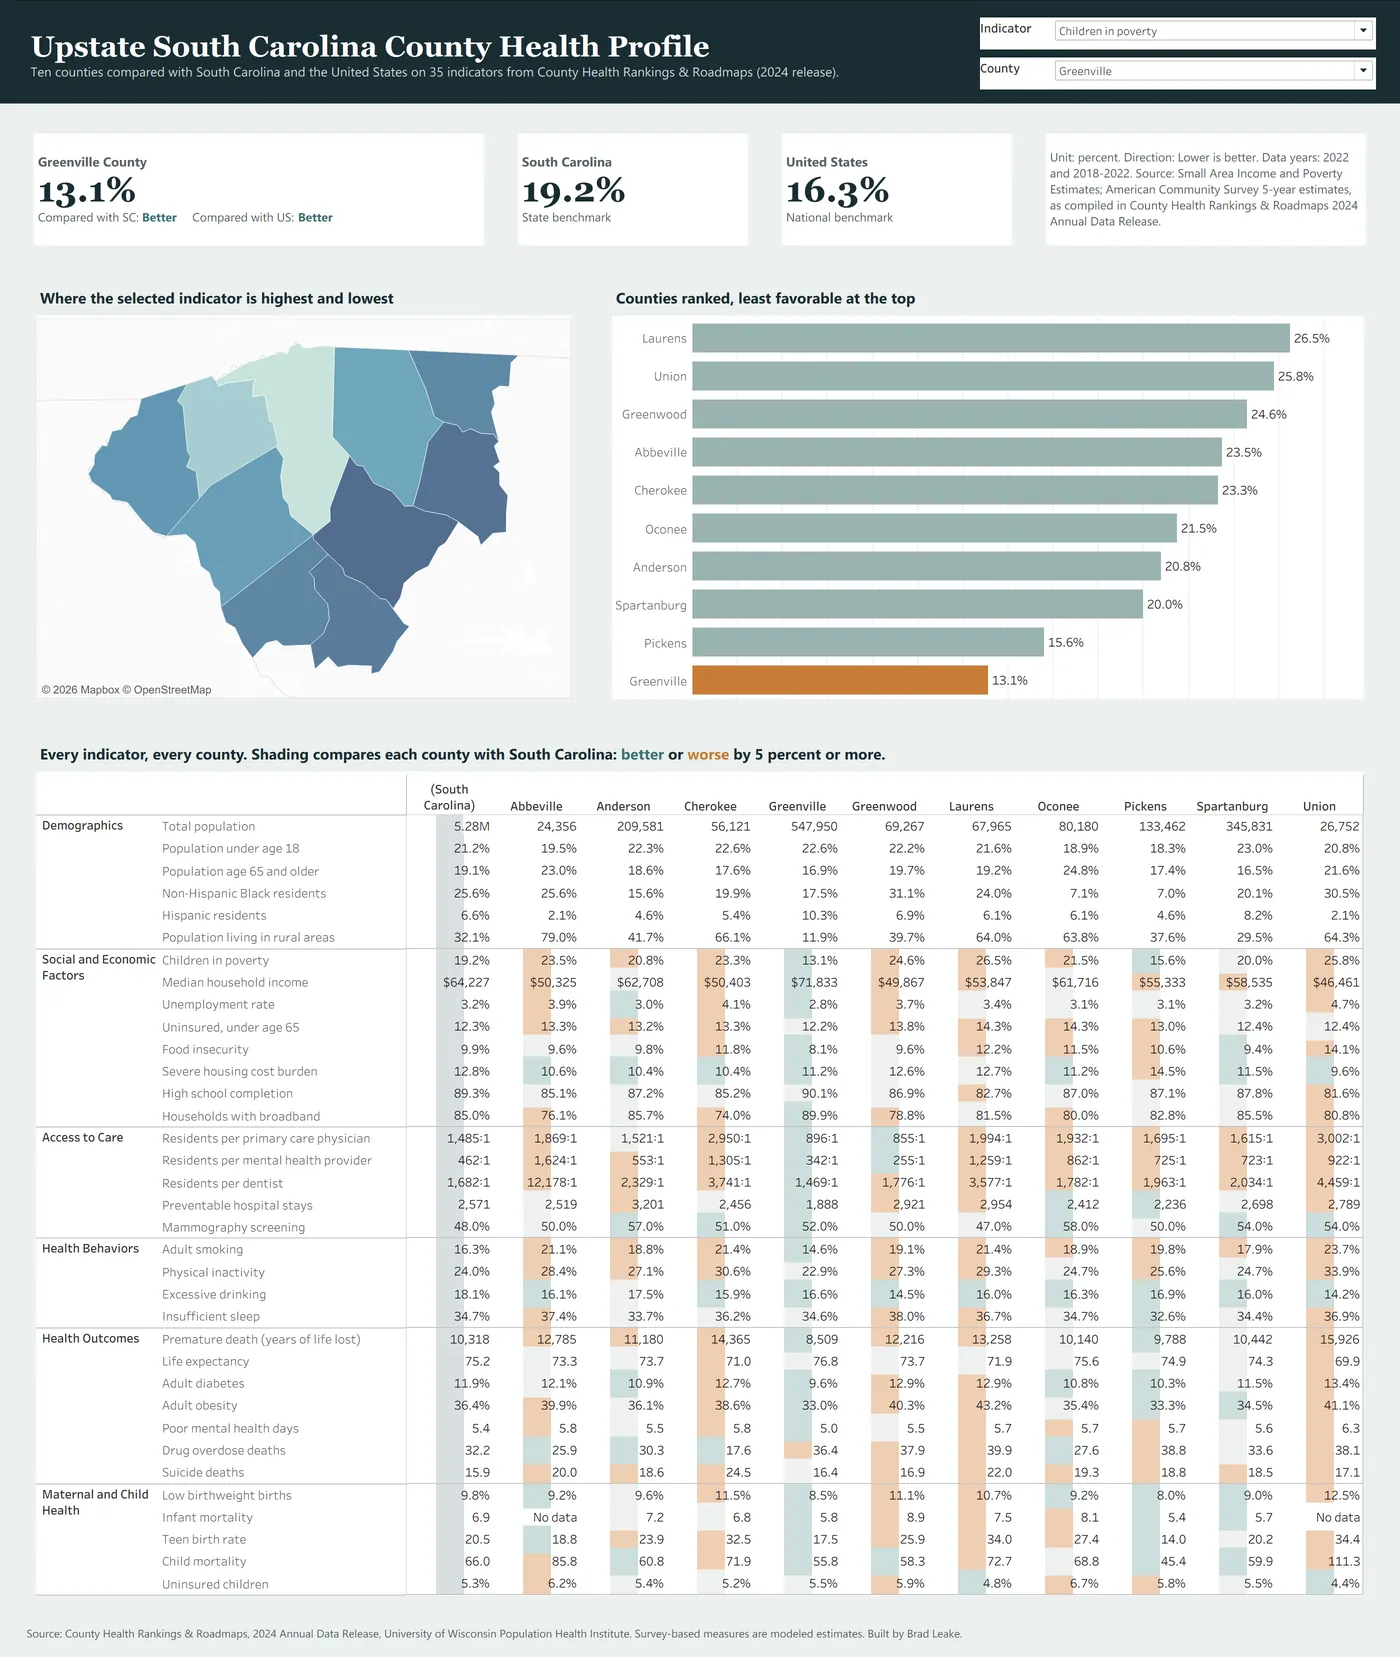
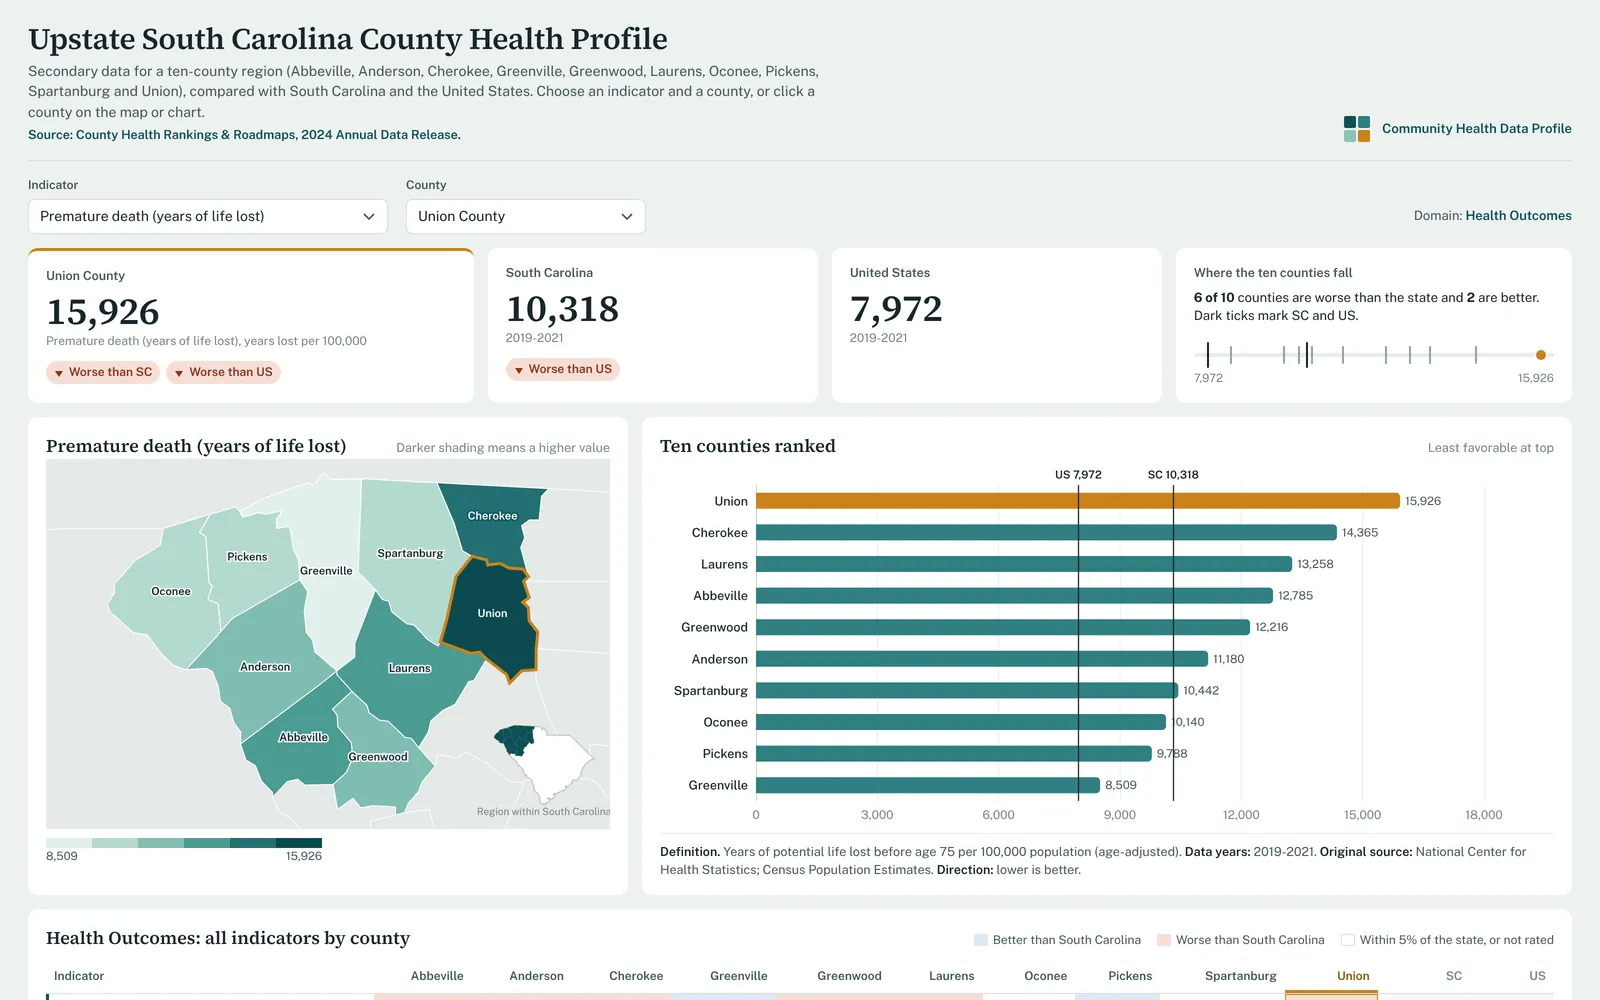
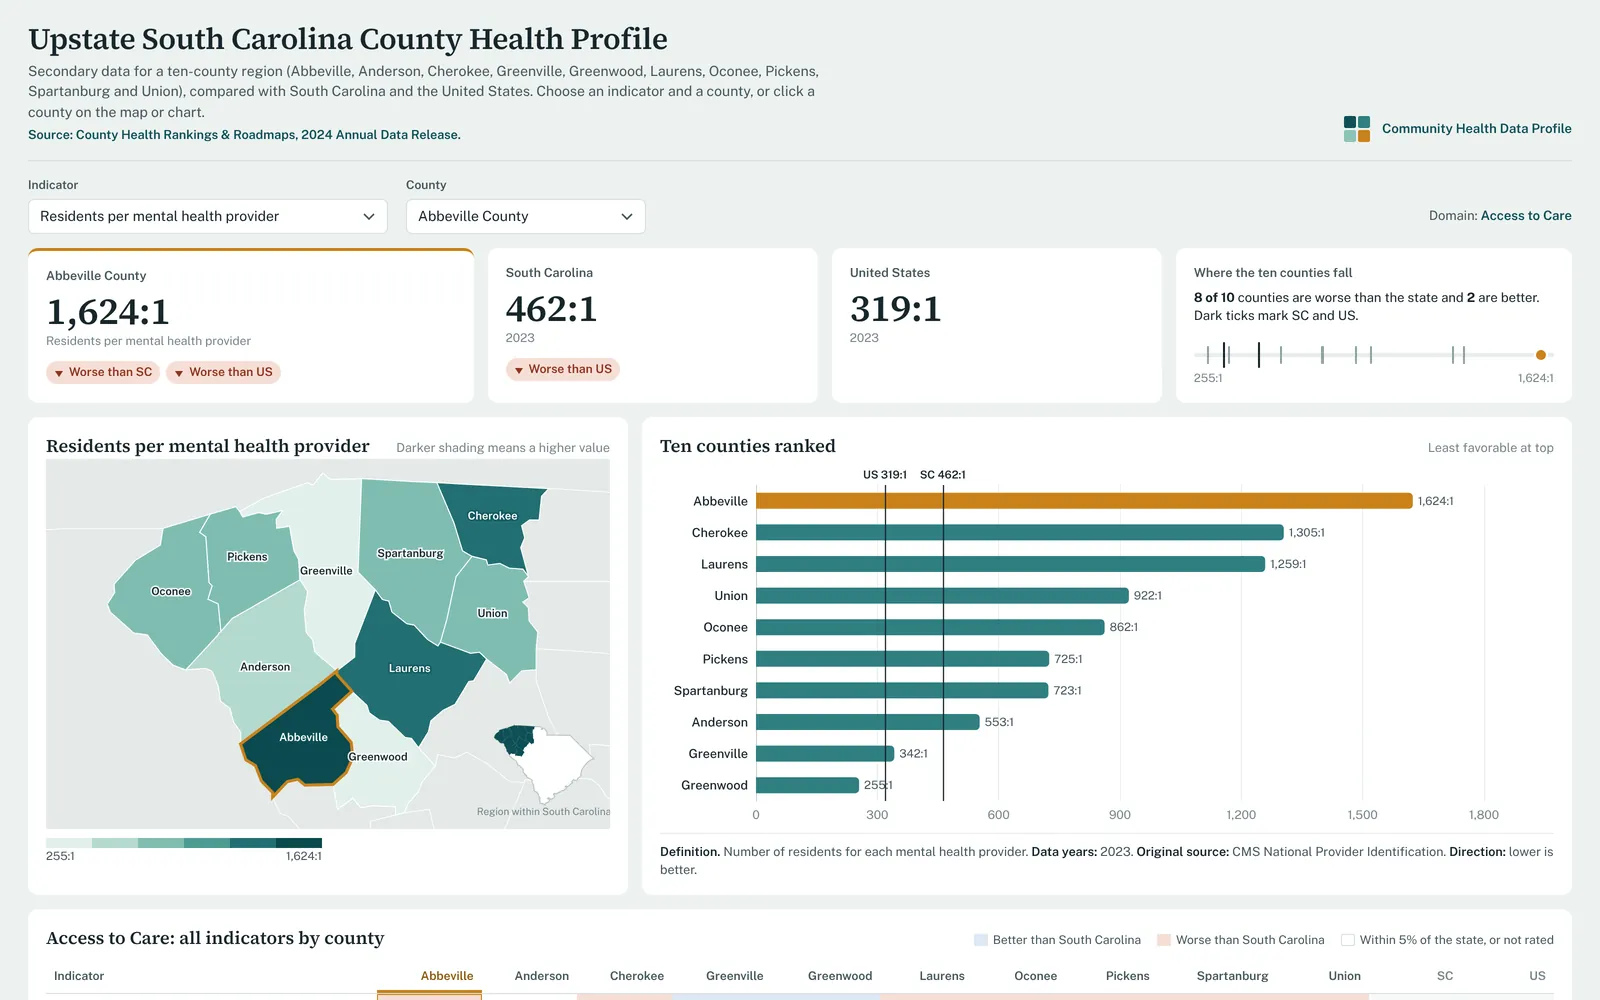
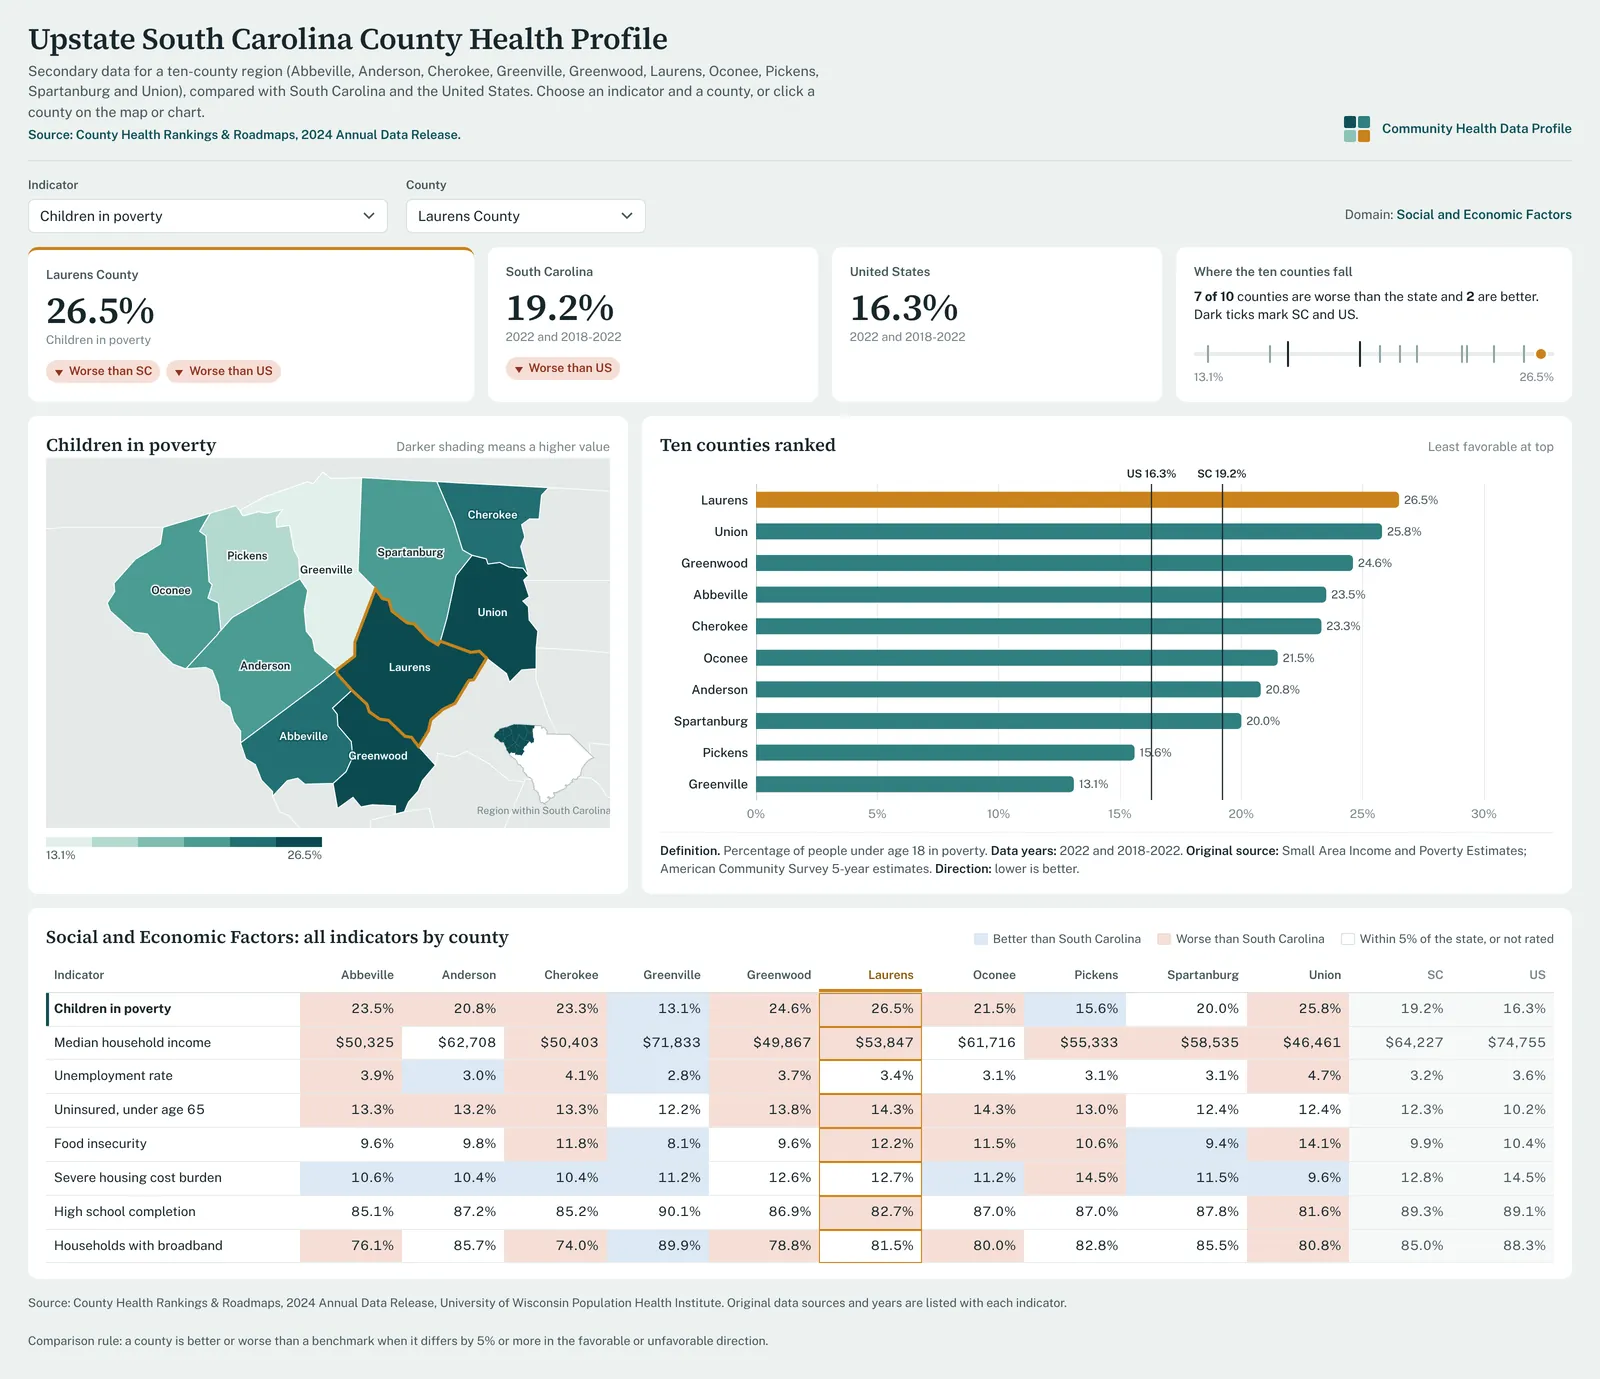
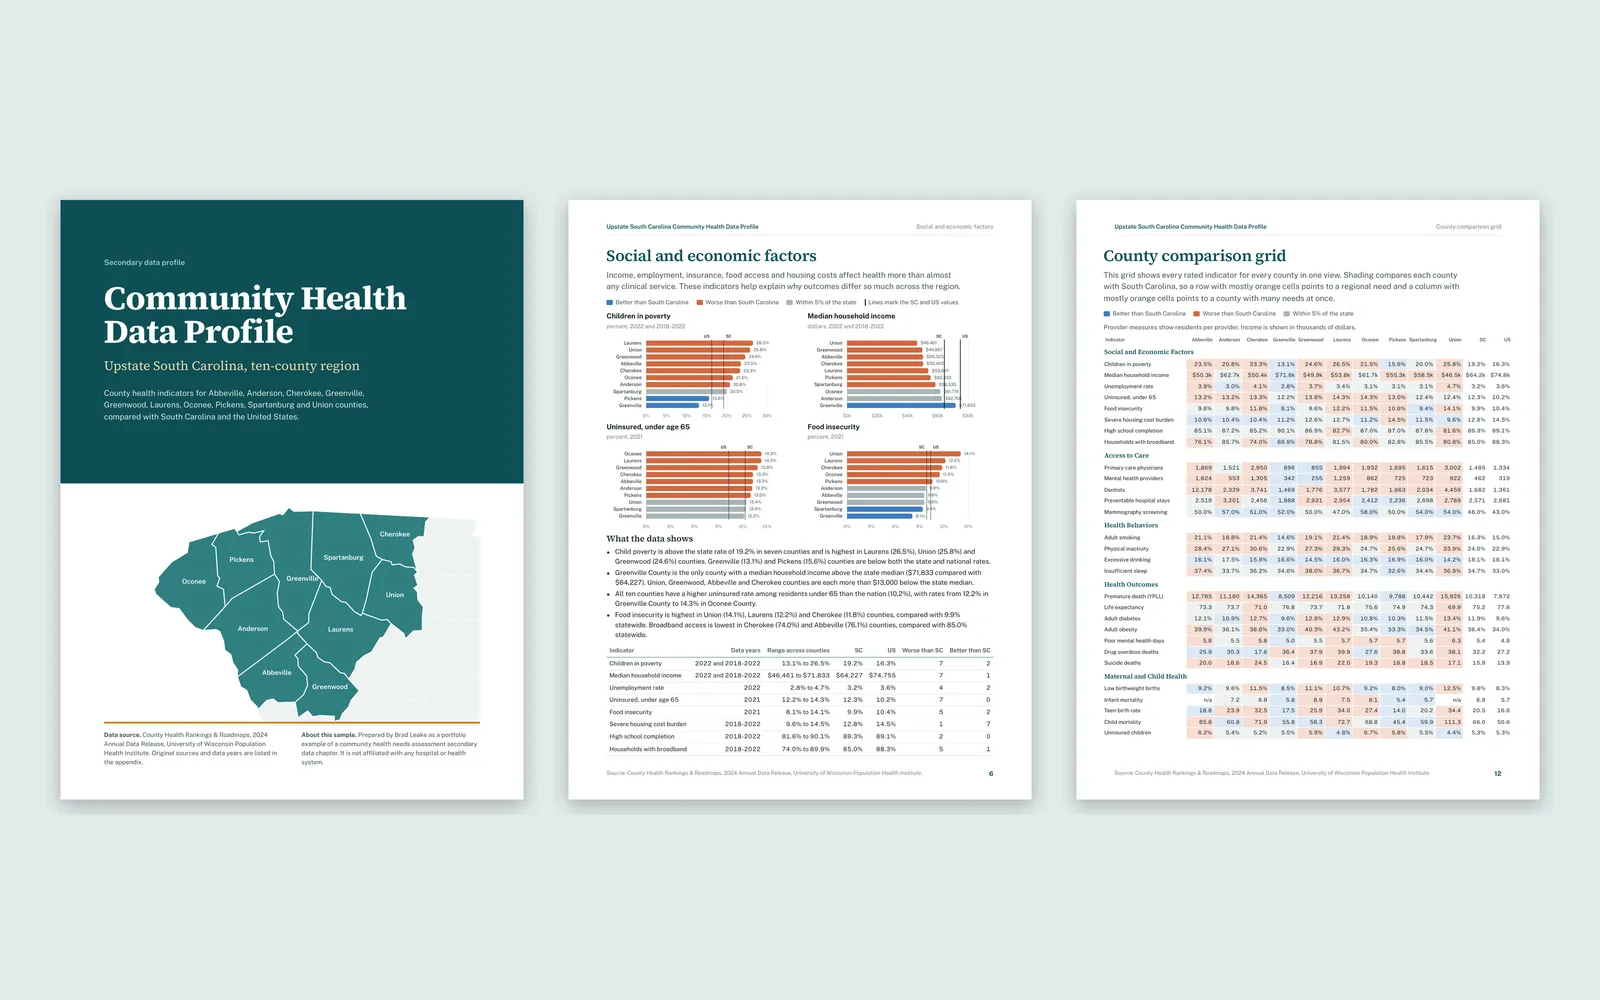
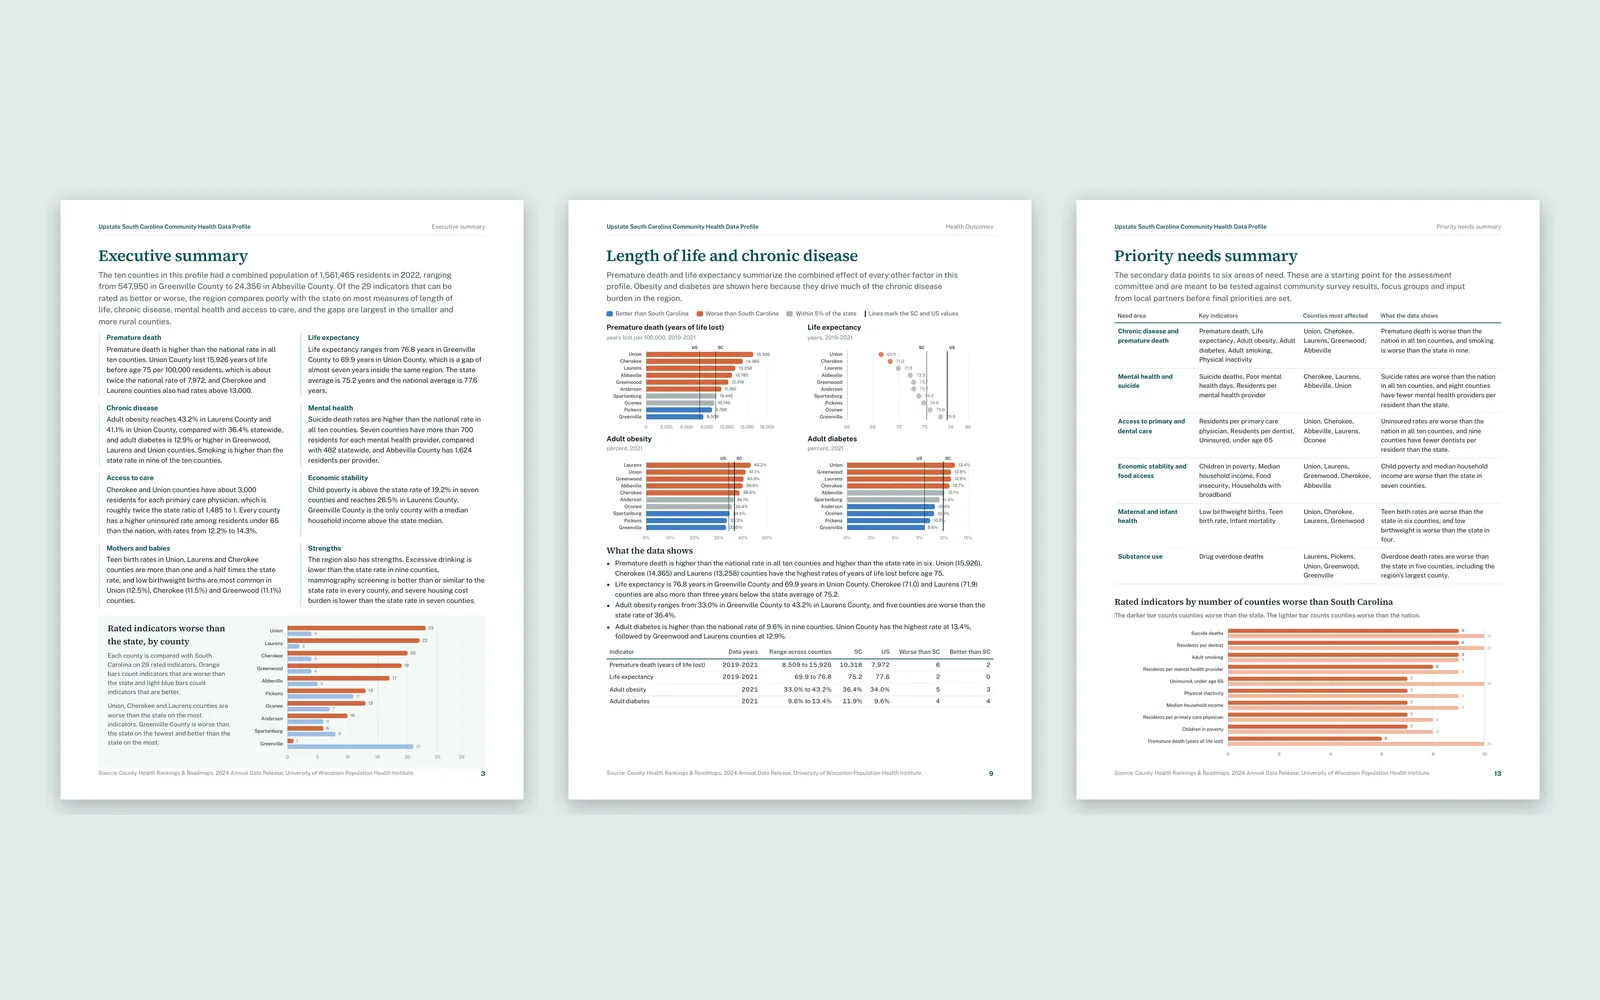
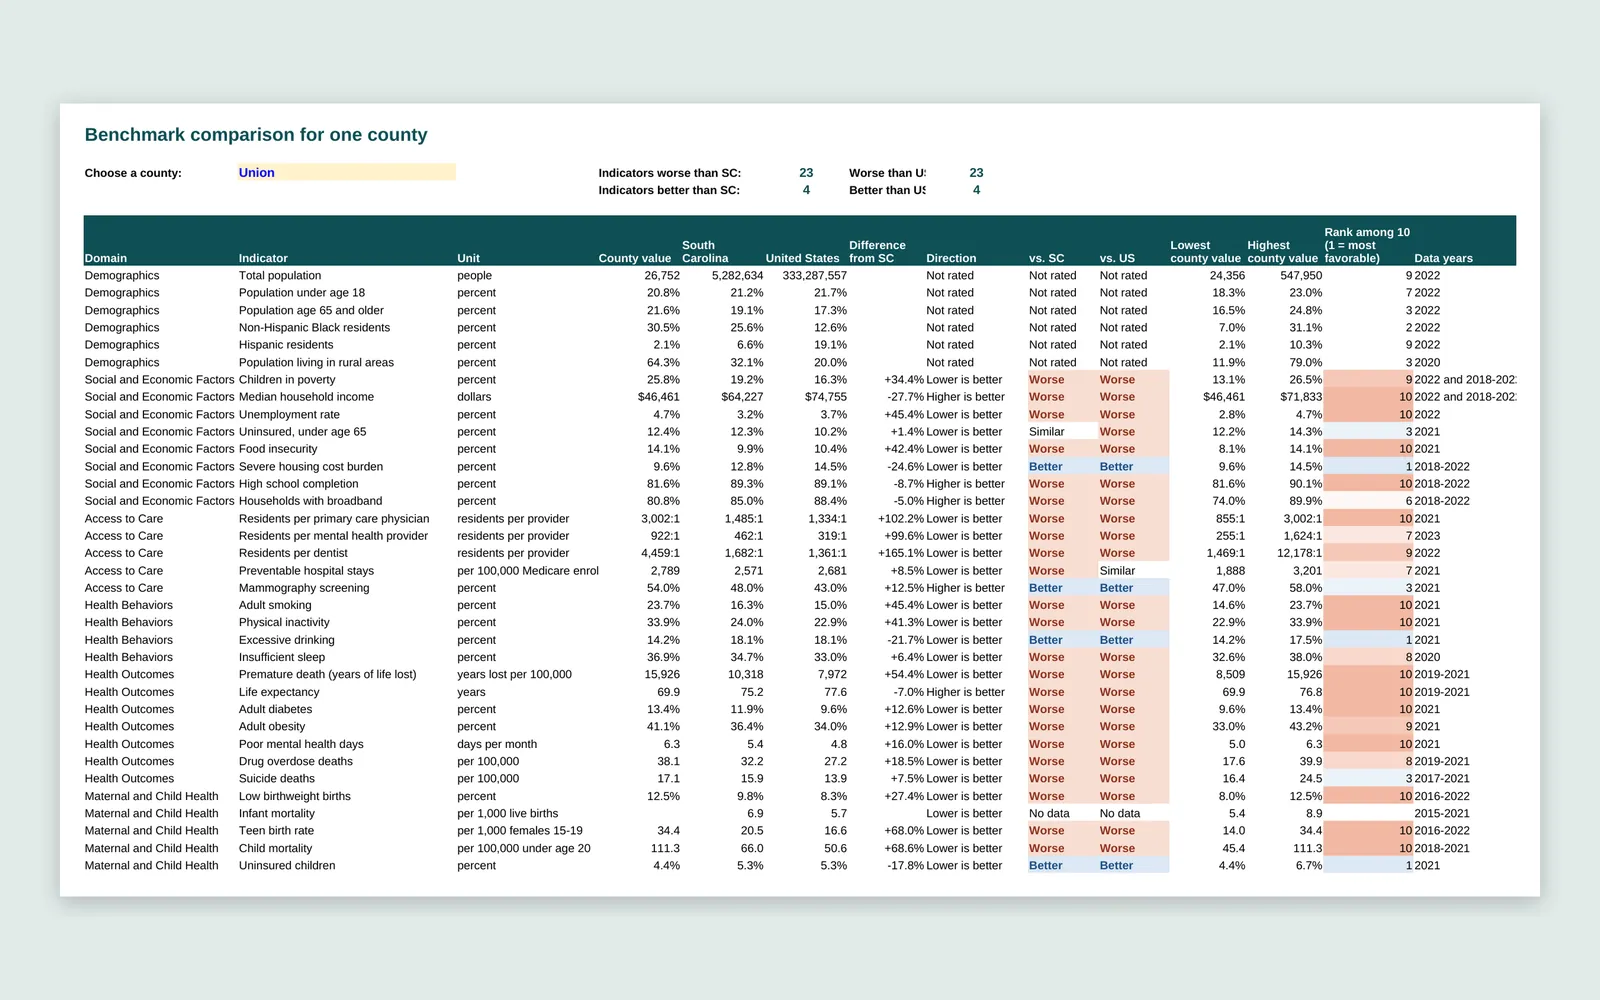
This product is the secondary data chapter of a hospital community health needs assessment, built for a ten-county region with real public data. It covers demographics, social and economic factors, access to care, health behaviors, health outcomes and maternal and child health, and it flags each county as better, worse or similar to South Carolina and the United States. A planning committee can use it to see which needs are regional and which are concentrated in a few counties before it moves on to community surveys and focus groups.
The Tableau dashboard and the interactive web version both have a county map, an indicator selector, KPI cards with benchmark comparisons, a ranked bar chart and a color-coded indicator table. The report has an executive summary, a methods and sources page, a page per domain with charts and plain findings, a county comparison grid and a priority needs table. The Excel workbook keeps the data in one long table so newer downloads can be pasted in and every comparison recalculates. The Tableau workbook is included as a packaged file that opens in Tableau Public or Tableau Desktop.