Public Sector and Human Services

Policy Brief: Reading the CFSR Round 4 Statewide Data Indicators

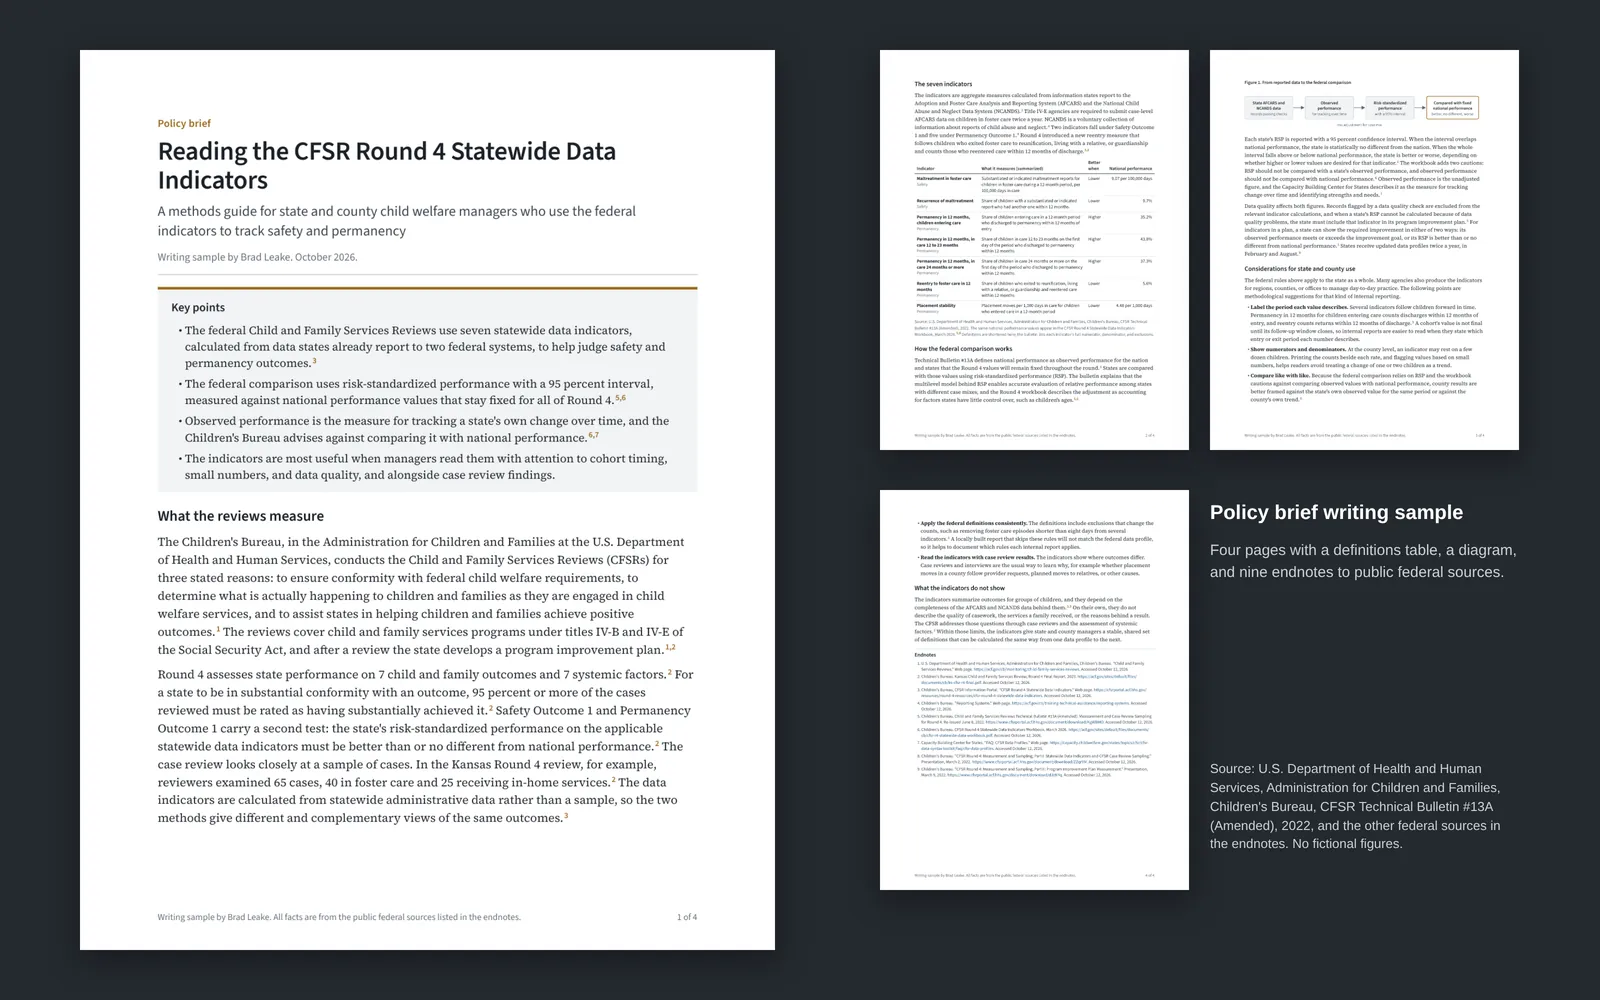
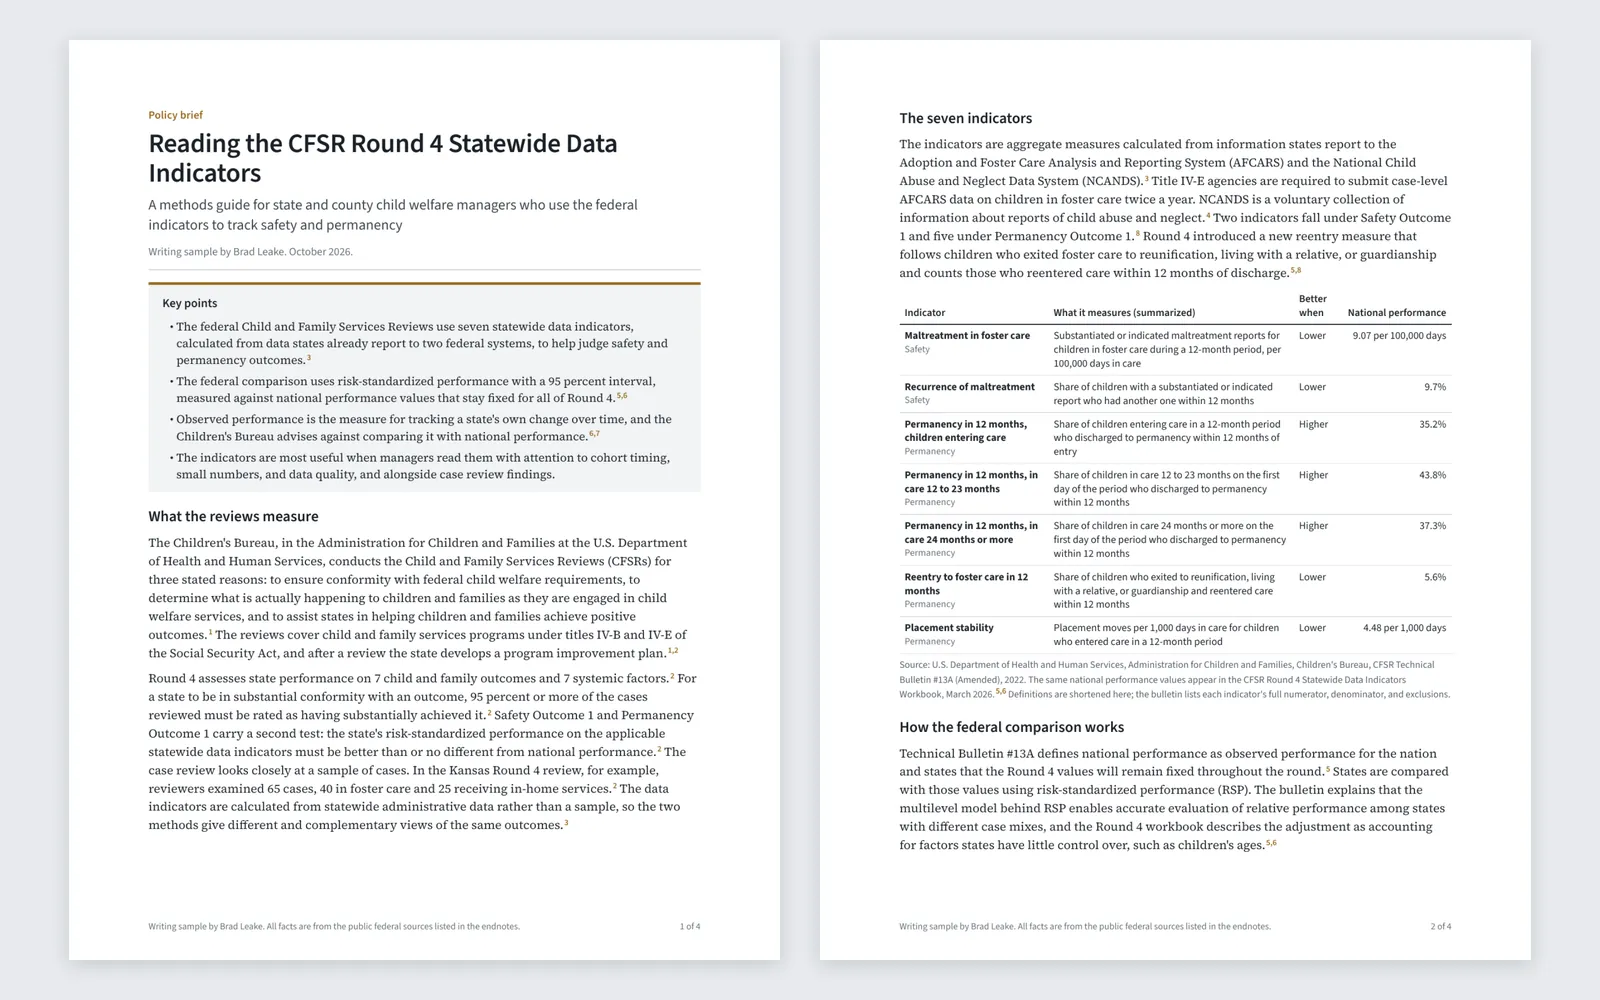
This 4-page methods brief explains to state and county child welfare managers how the federal CFSR Round 4 statewide data indicators are defined, how the federal comparison works, and how to use the indicators carefully in internal reporting. Every factual statement is sourced to a public federal document.

Source: U.S. Department of Health and Human Services, Administration for Children and Families, Children's Bureau, CFSR Technical Bulletin #13A (Amended), 2022, and the other public federal sources listed in the endnotes. The brief contains no fictional figures.

Policy Brief: Reading the CFSR Round 4 Statewide Data Indicators: OverviewOpen larger image

About this sample

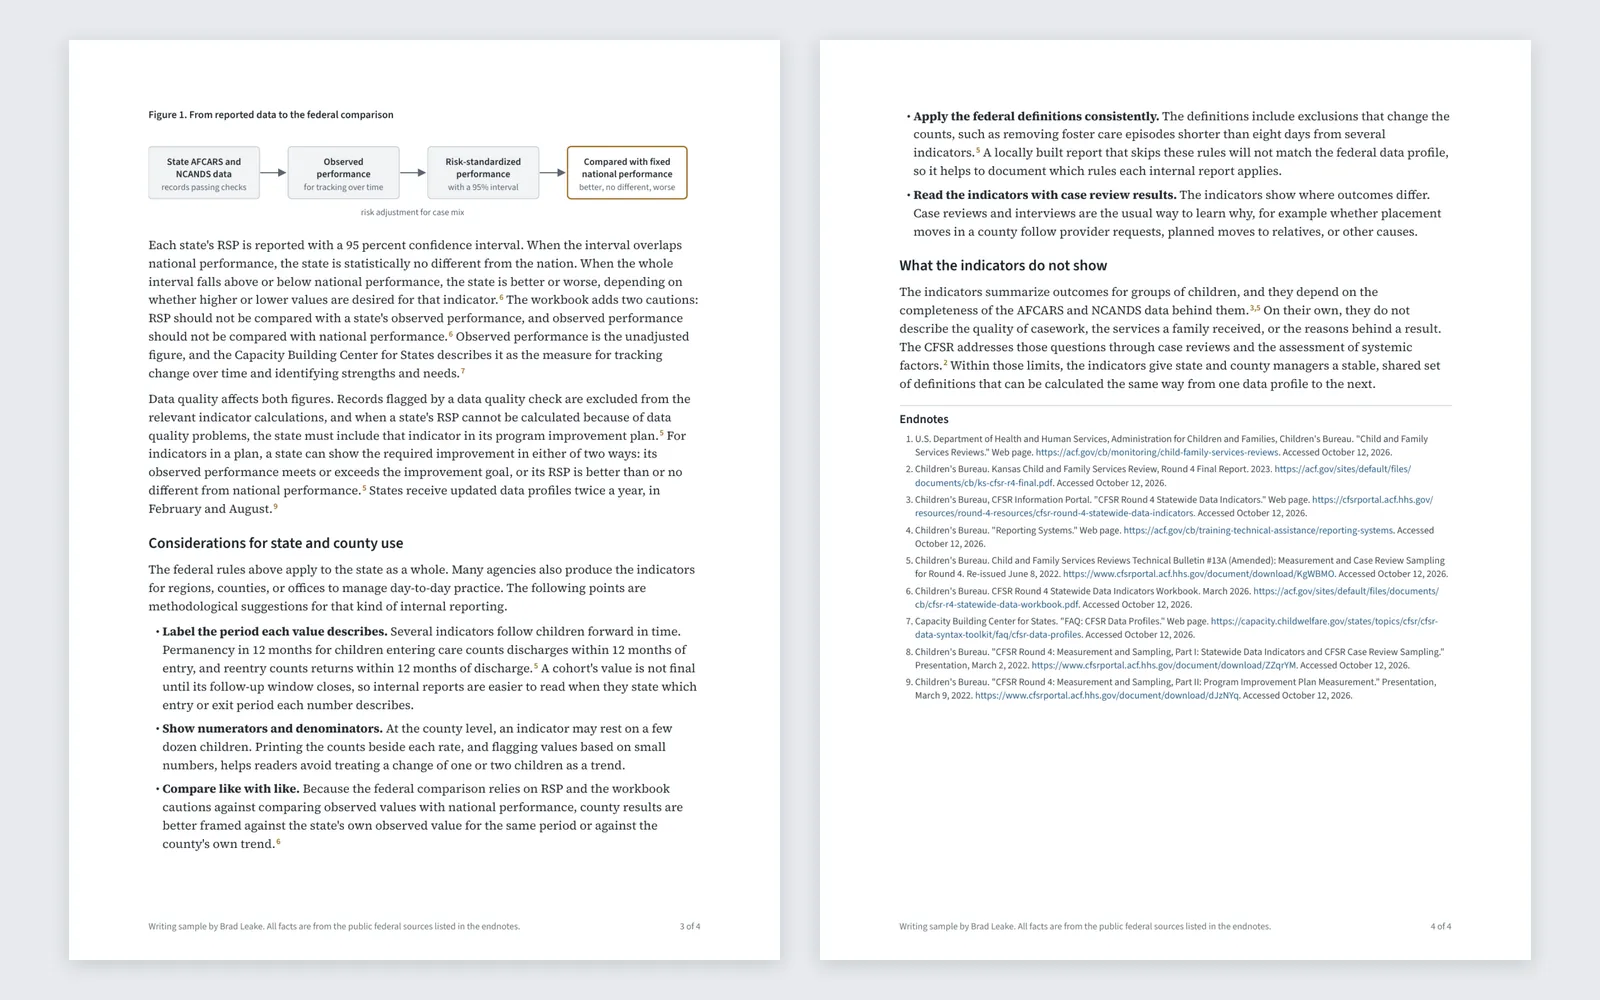
The brief explains what the Child and Family Services Reviews measure, what each of the seven statewide data indicators counts, and how risk-standardized performance, confidence intervals, and fixed national performance values work in the federal comparison. It then offers practical, even-handed suggestions for state and county reporting, such as labeling cohort periods, showing numerators and denominators, and reading the indicators alongside case review results.

It is a writing sample that shows how Brad explains a technical federal measurement system in plain language for program managers. It takes no policy position, and all of its facts come from Children's Bureau publications and related federal sources listed in nine endnotes.

What it includes

  • Plain-language explanation of the CFSR outcomes, systemic factors, and substantial conformity rules
  • Table of the seven indicators with summarized definitions and national performance values
  • Diagram of how reported data become the federal comparison
  • Practical considerations for county and regional reporting
  • Nine endnotes to public federal sources

Screenshots

Select an image to see it larger.

More in Public Sector and Human Services

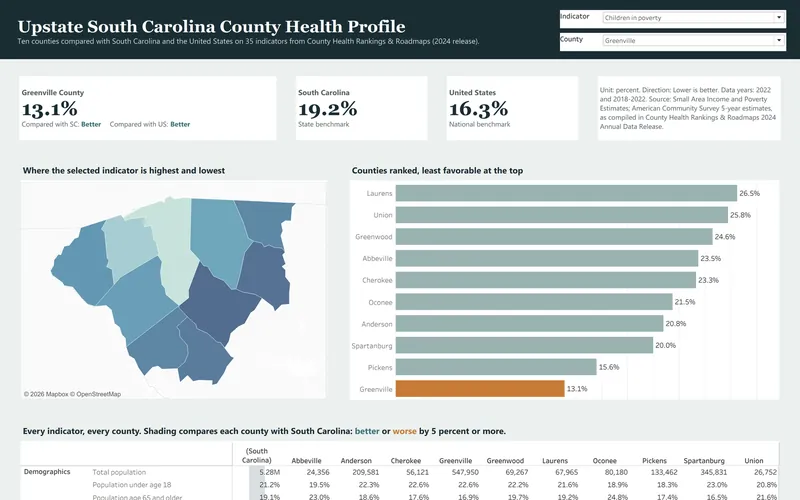
County Health Profile: Upstate South Carolina

This is the secondary data profile from a community health needs assessment for ten Upstate South Carolina counties, and it is built from the 2024 County Health Rankings release. It compares 35 county indicators with state and national values and turns them into a dashboard, a 14-page report and an Excel workbook.

  • Excel
  • Tableau
  • PDF report

Public data

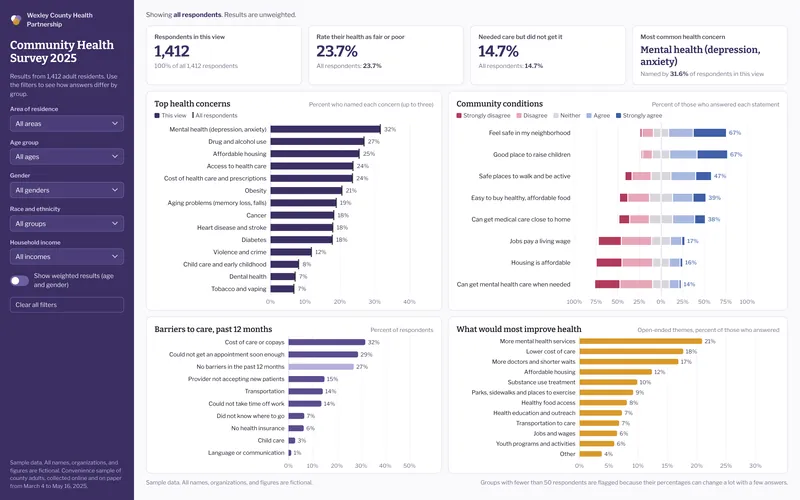
Community Health Survey Results

This sample analyzes a fictional county community health survey with 1,412 respondents, which is the kind of survey hospitals run as part of a community health needs assessment. It includes a filterable dashboard, an 8-page results brief and an Excel workbook with crosstabs, a codebook and weighting.

  • Excel
  • Power BI
  • PDF report

Sample data