Dashboards and Business Intelligence

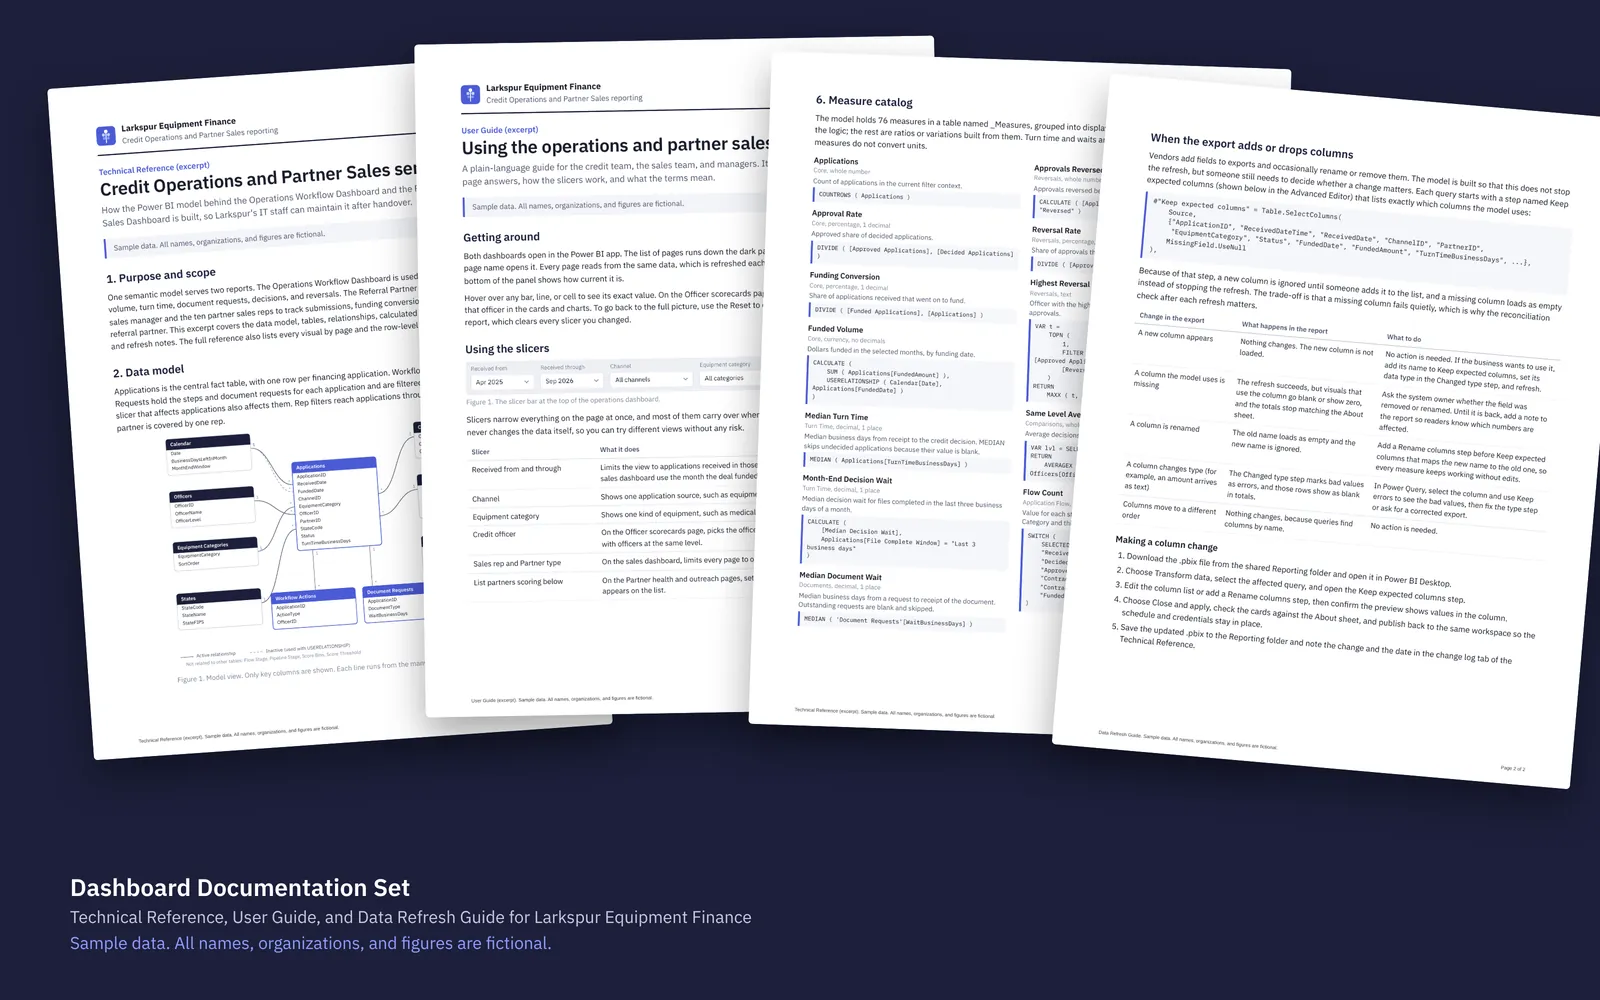
Dashboard Documentation Set

This set holds three short handover documents for the operations and partner sales dashboards: a technical reference for IT staff, a plain-language user guide, and a data refresh guide. Together they show how a Power BI model is handed to a client so their own staff can run and maintain it.

Sample data. All names, organizations, and figures are fictional.

Dashboard Documentation Set: OverviewOpen larger image

About this sample

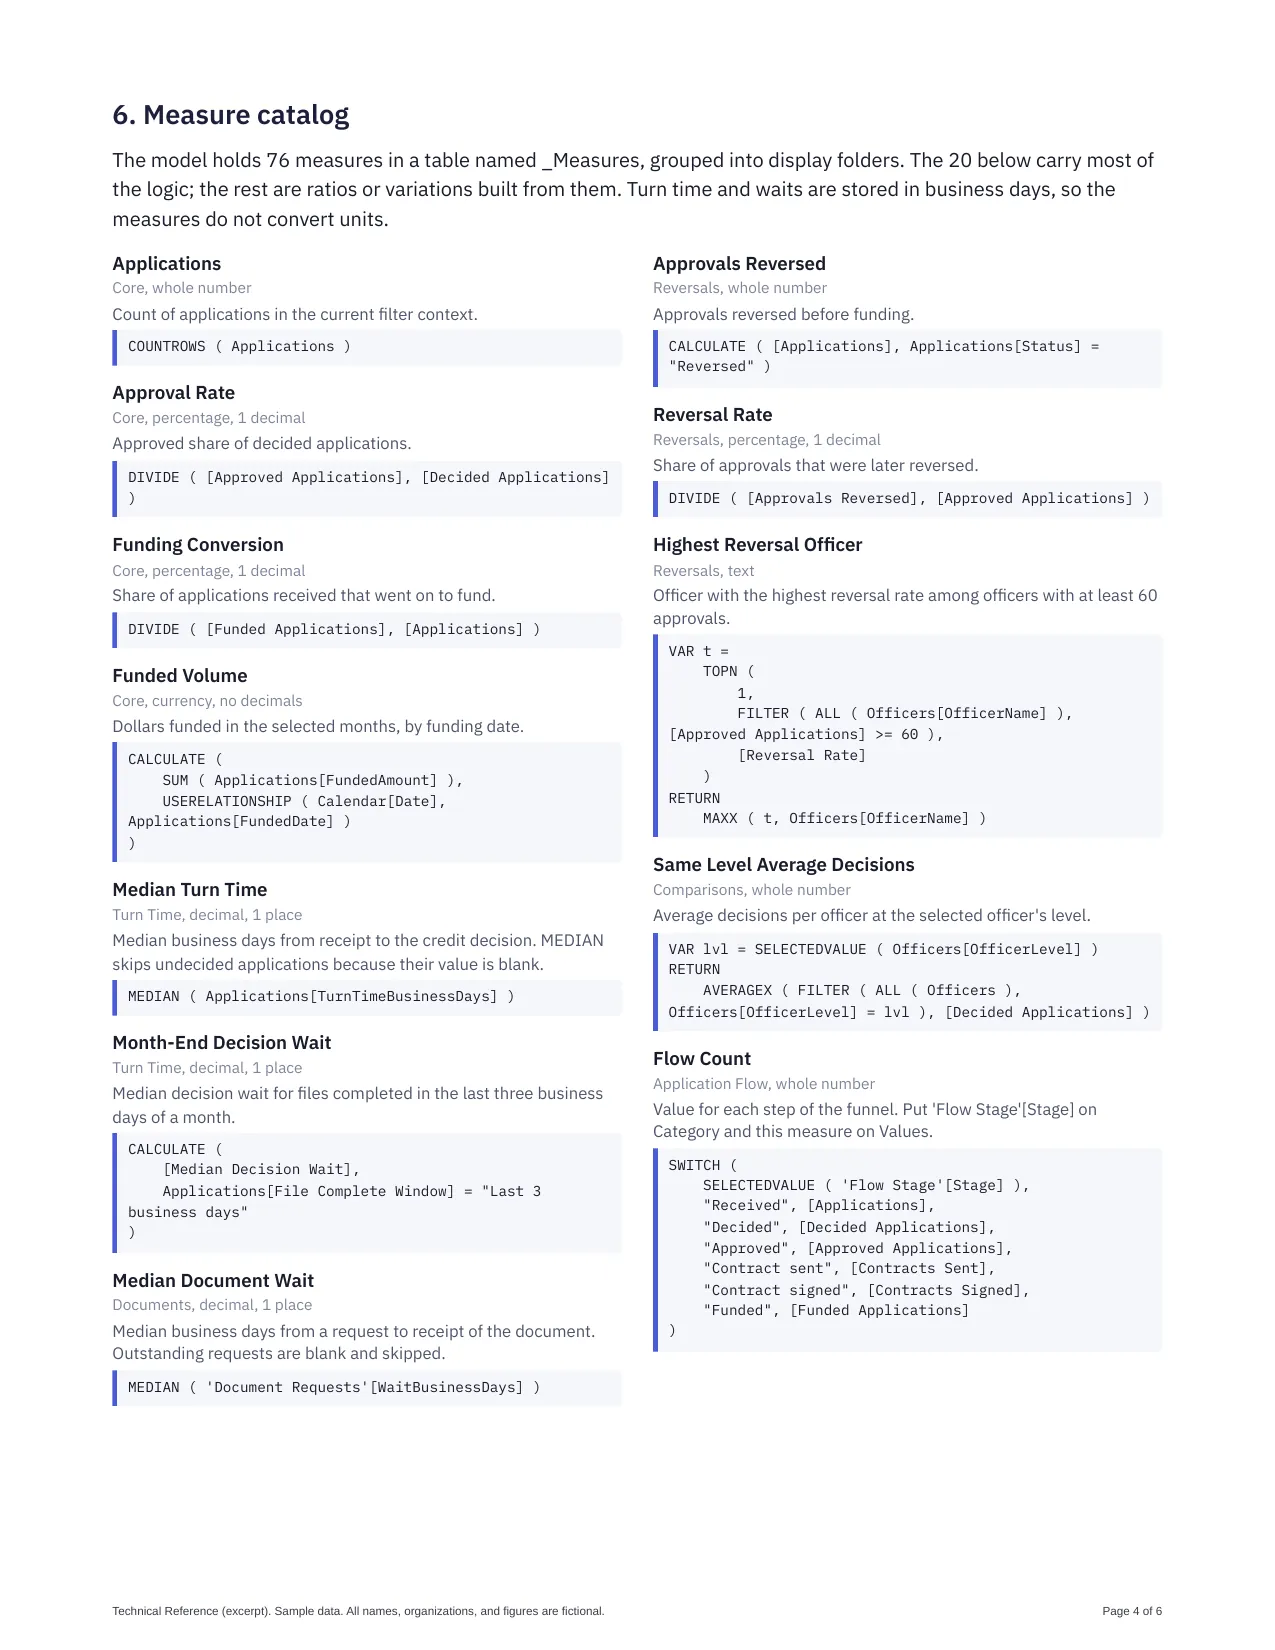
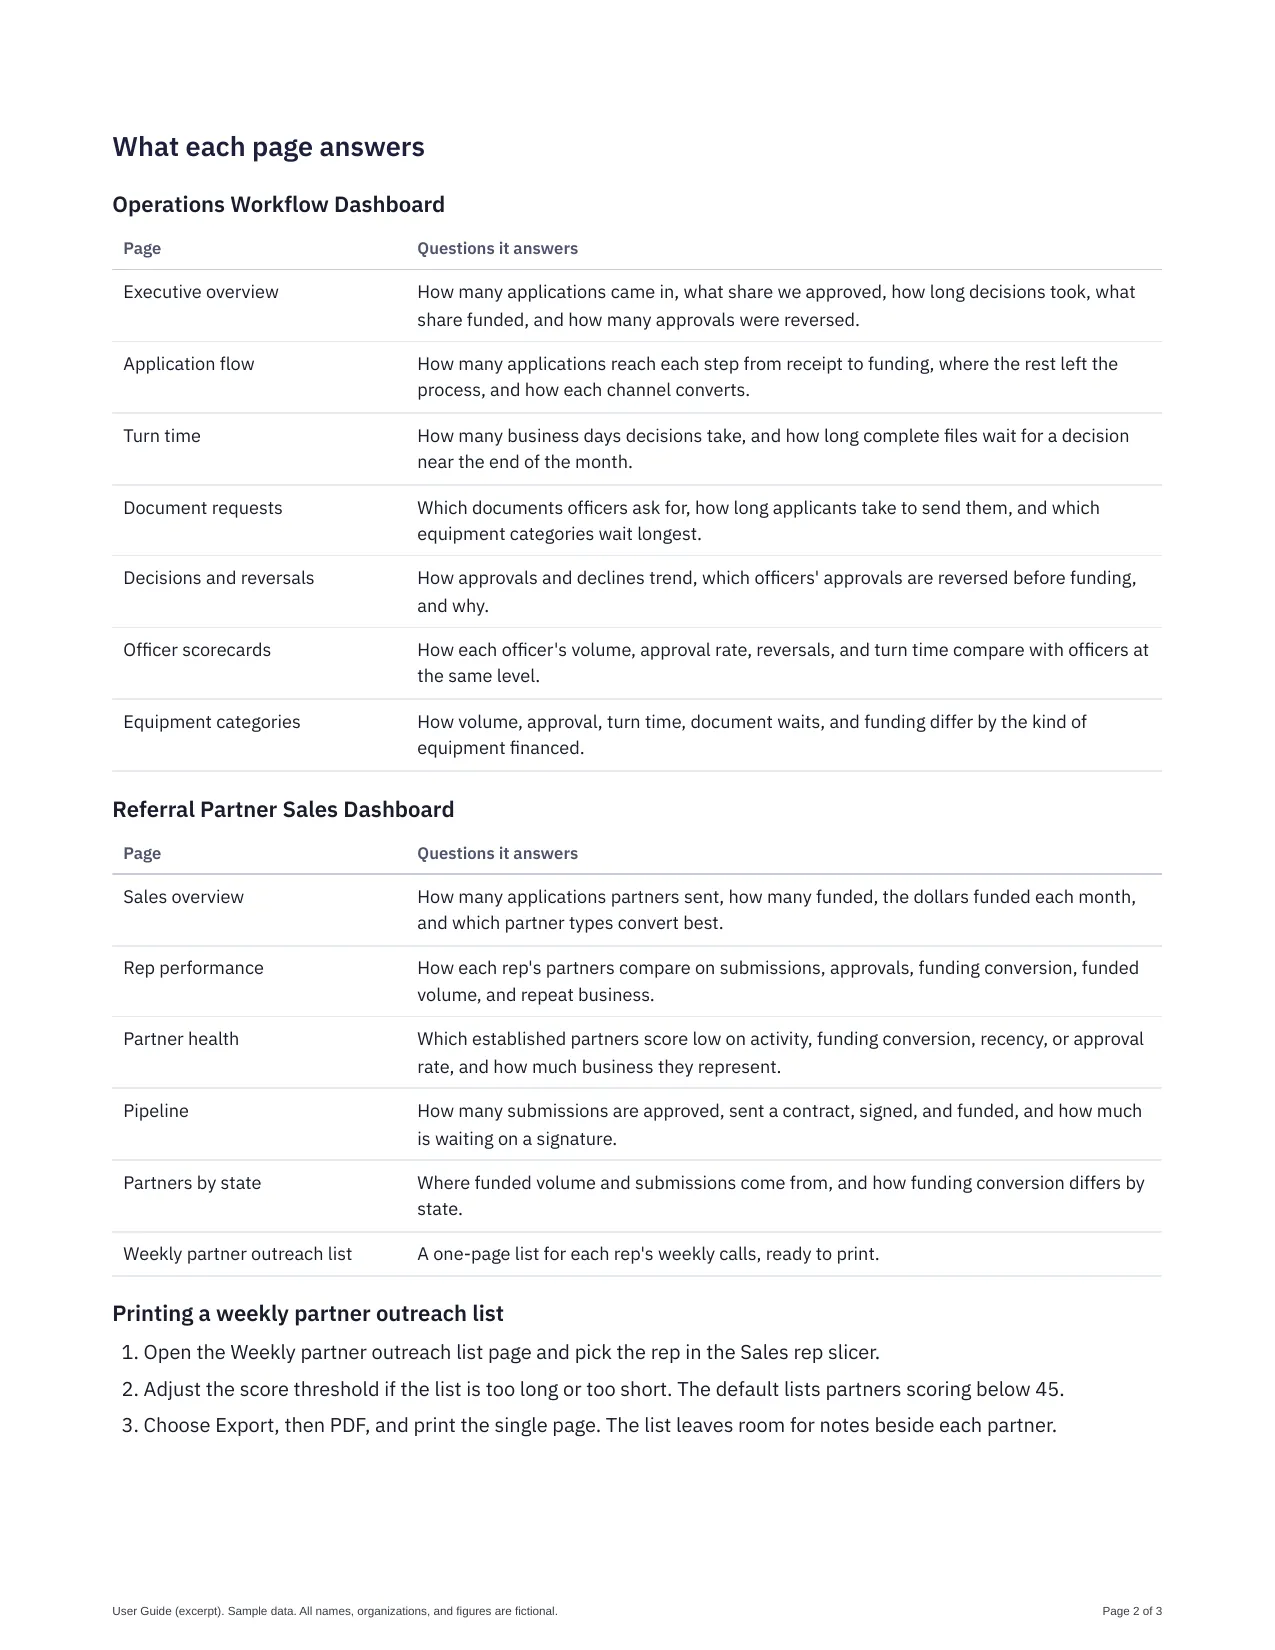
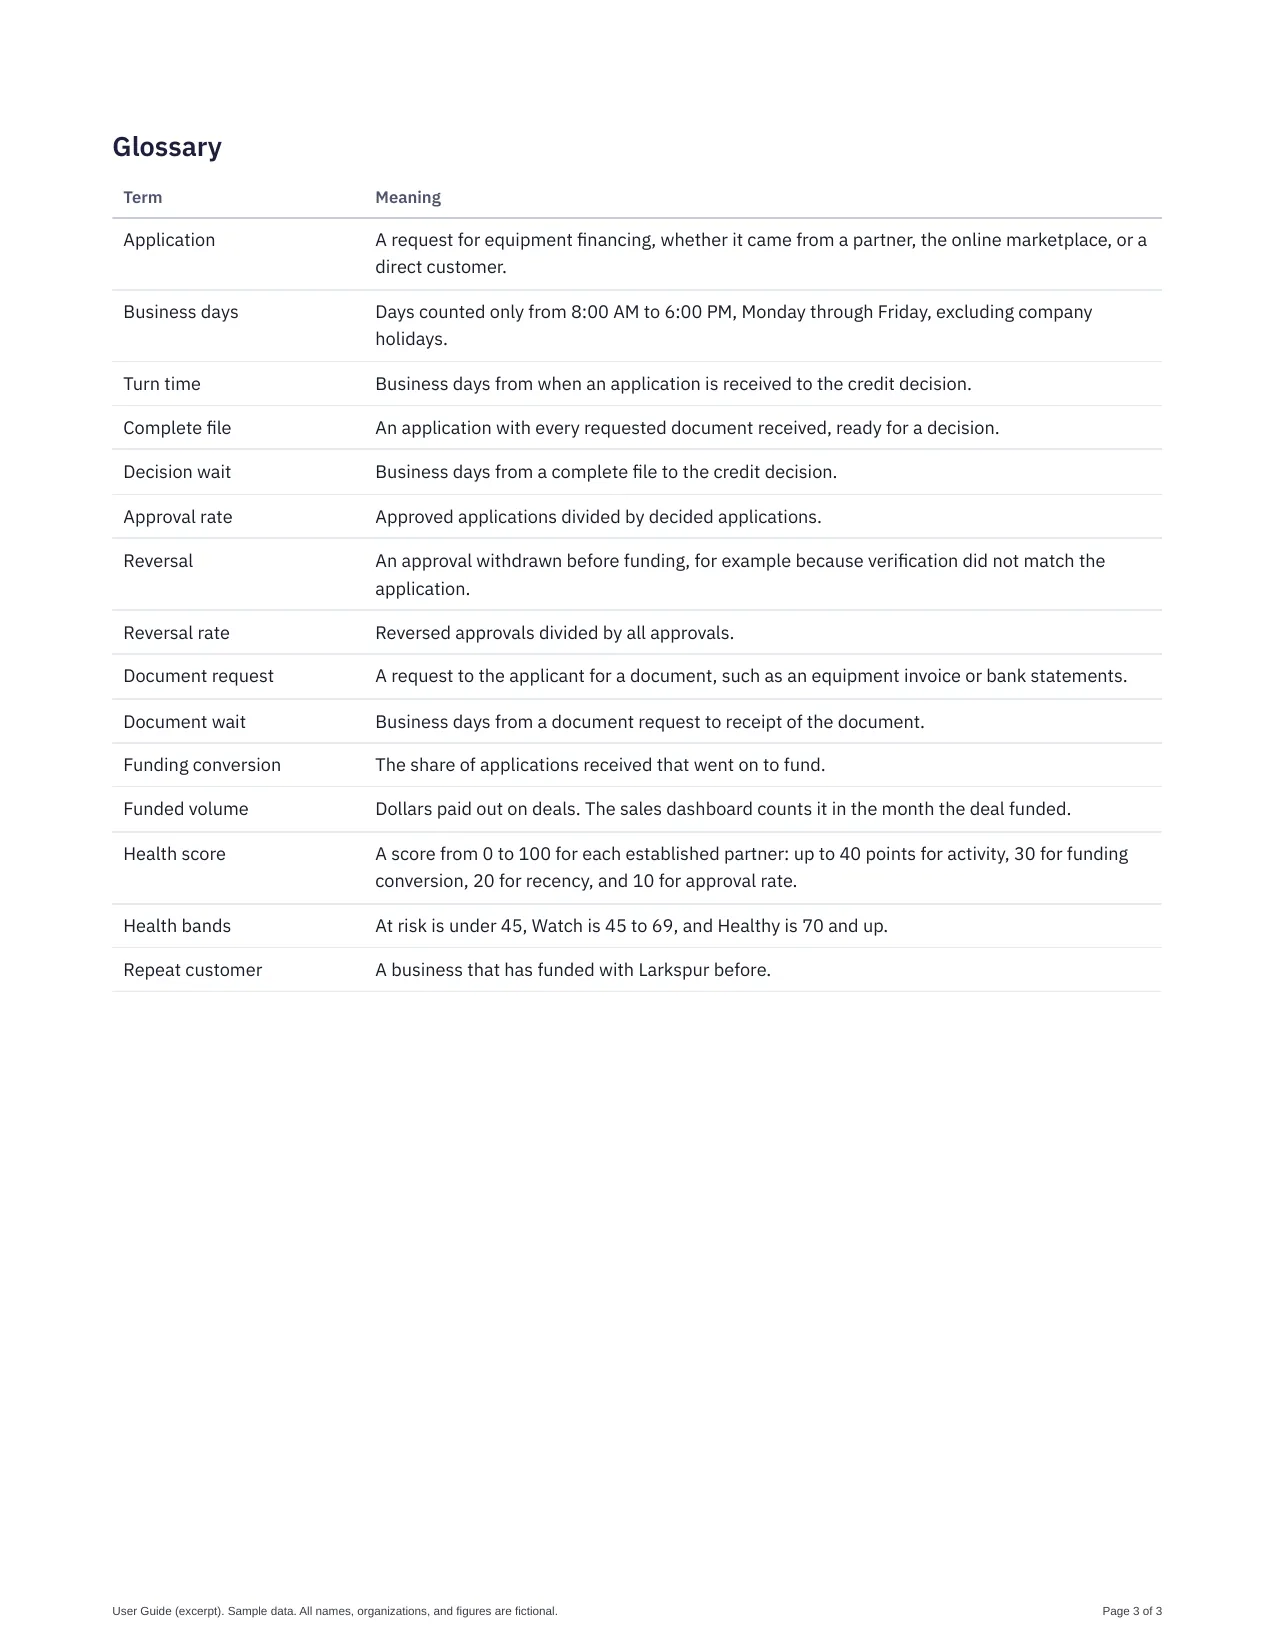
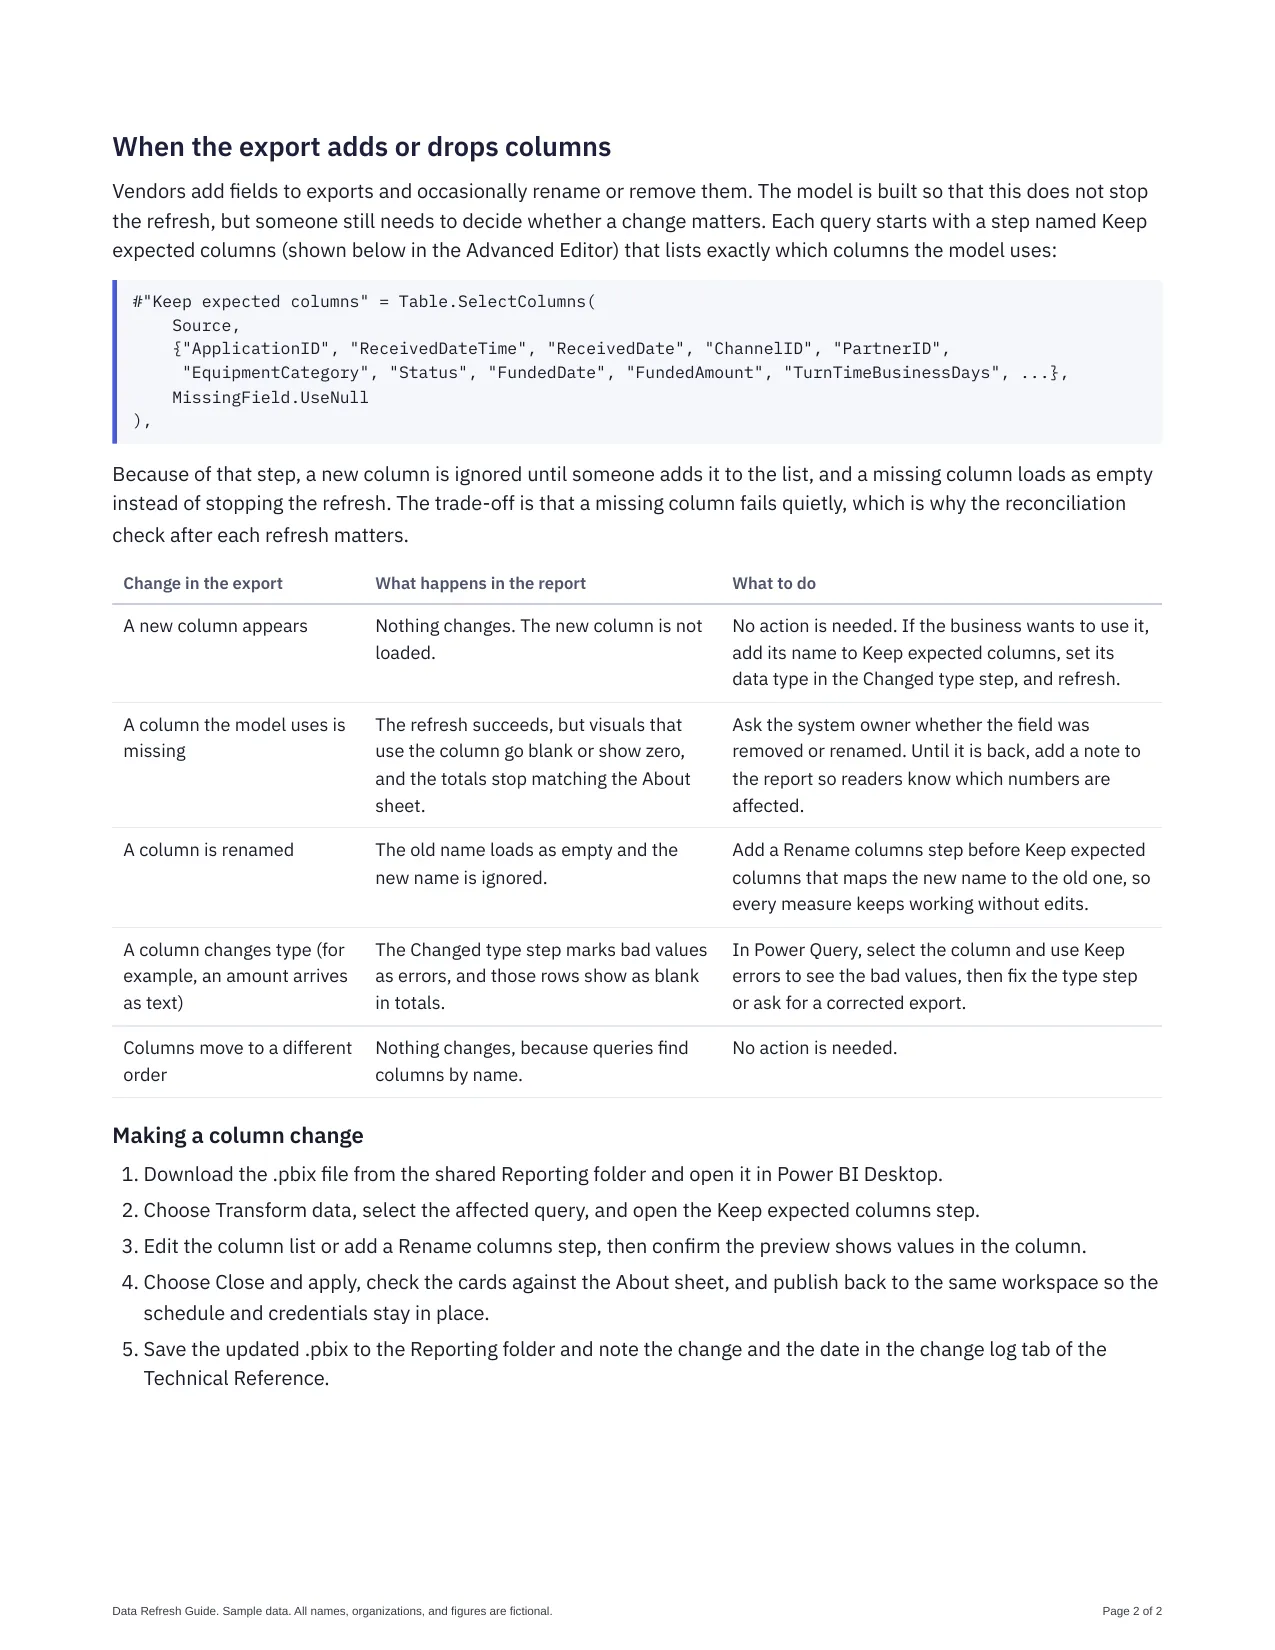
The Technical Reference excerpt covers the data model diagram, every table and relationship, the calculated tables and columns, a catalog of 20 key measures with their DAX, and refresh notes. The User Guide excerpt explains what each page answers, how the slicers work, how to print a weekly partner outreach list, and what the terms mean. The Data Refresh Guide walks through a manual refresh, what to check afterward, and what to do when the source export adds, drops, renames, or retypes a column.

All three documents describe the Operations Workflow Dashboard and the Referral Partner Sales Dashboard for the same fictional equipment finance company, so a reader can compare the documents with the working dashboards.

What it includes

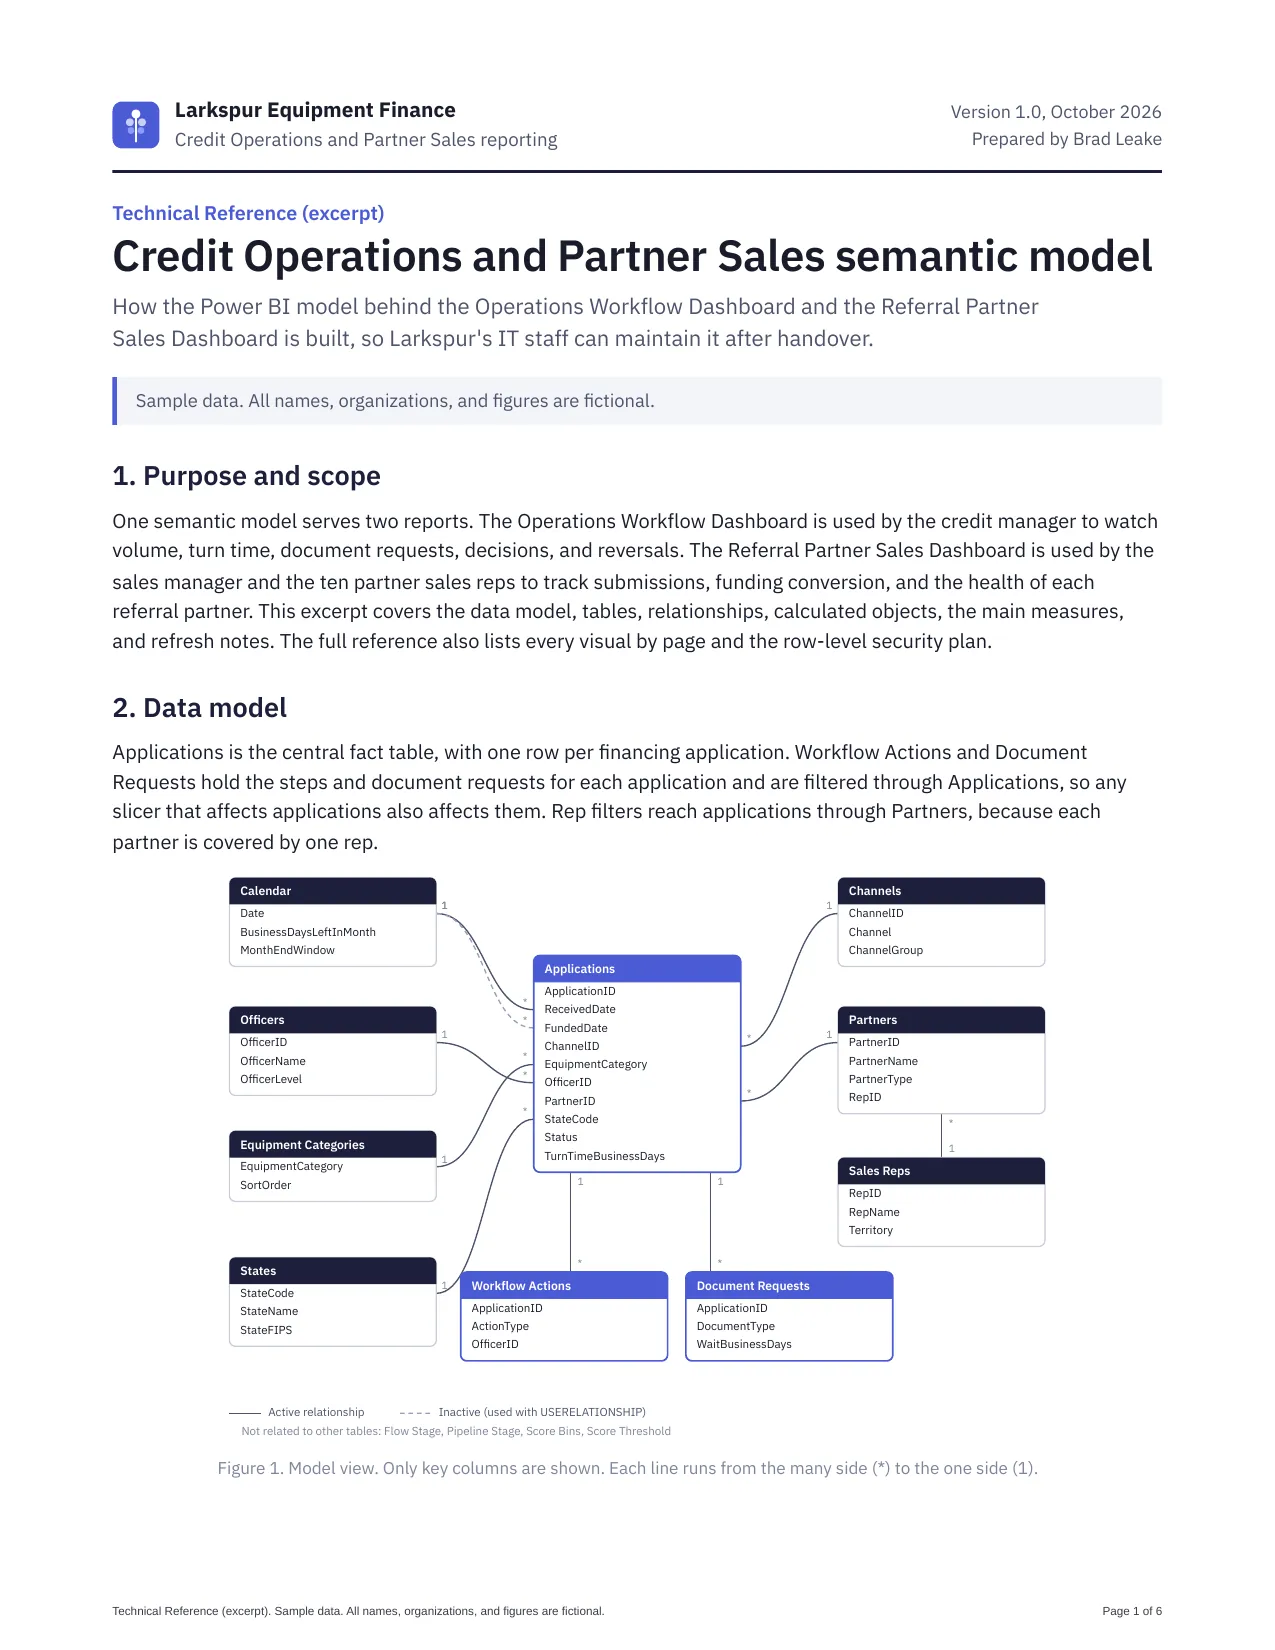
  • Technical Reference excerpt (6 pages) with a data model diagram and a measure catalog in DAX
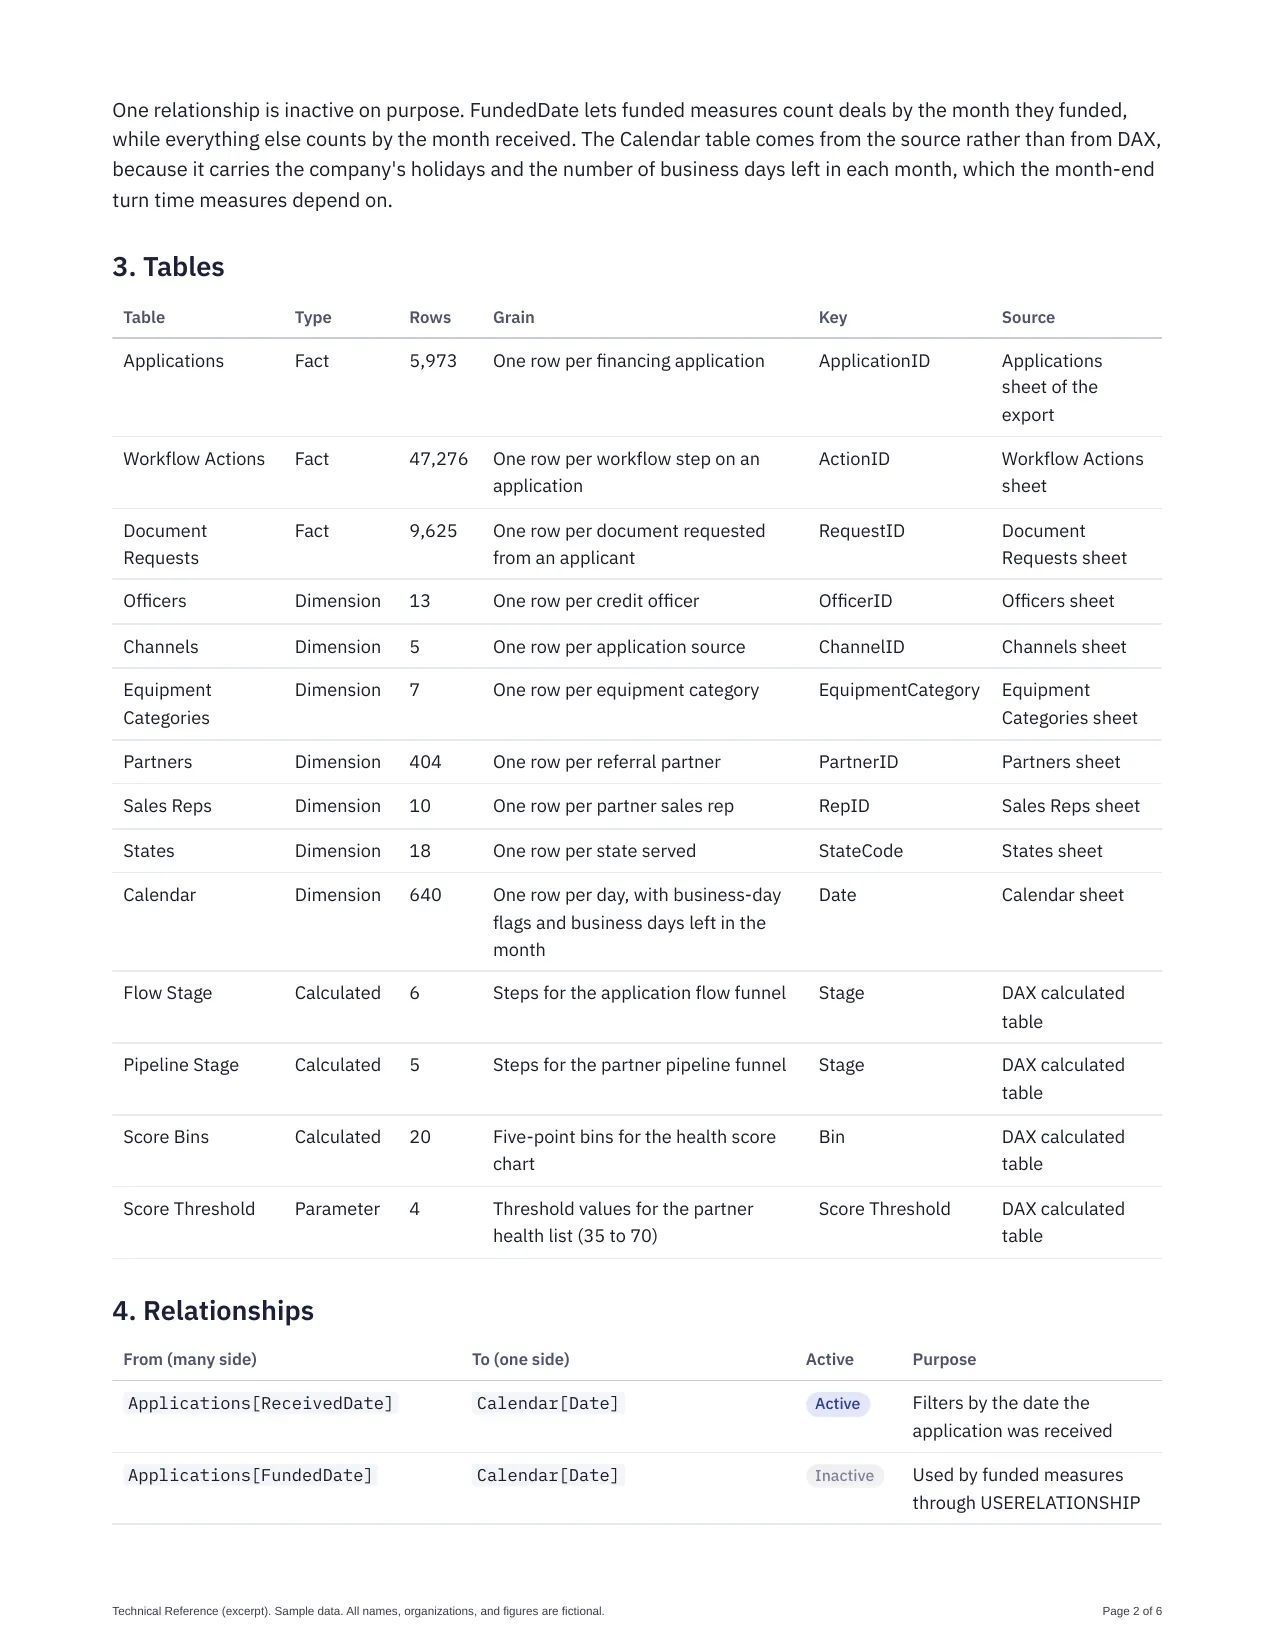
  • Table and relationship lists, including why the funded-date relationship is inactive
  • User Guide excerpt (3 pages) with a page-by-page guide and a glossary
  • Data Refresh Guide (2 pages) with a step-by-step refresh and checks against reconciliation totals
  • A plan for source columns that are added, dropped, renamed, or change type
  • Writing for two audiences: IT staff who maintain the model and managers who use the reports

Screenshots

Select an image to see it larger.

More in Dashboards and Business Intelligence

County Health Profile: Upstate South Carolina

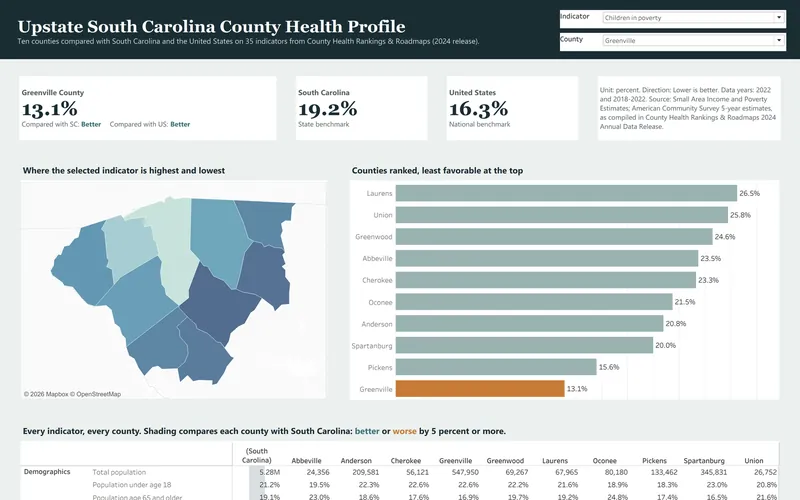
This is the secondary data profile from a community health needs assessment for ten Upstate South Carolina counties, and it is built from the 2024 County Health Rankings release. It compares 35 county indicators with state and national values and turns them into a dashboard, a 14-page report and an Excel workbook.

  • Excel
  • Tableau
  • PDF report

Public data

Community Health Survey Results

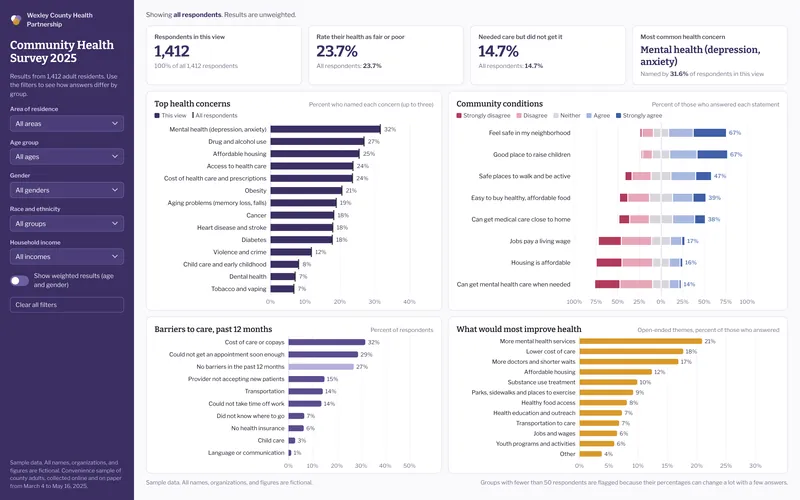
This sample analyzes a fictional county community health survey with 1,412 respondents, which is the kind of survey hospitals run as part of a community health needs assessment. It includes a filterable dashboard, an 8-page results brief and an Excel workbook with crosstabs, a codebook and weighting.

  • Excel
  • Power BI
  • PDF report

Sample data