Public Sector and Human Services

Contract Performance Monitoring Report

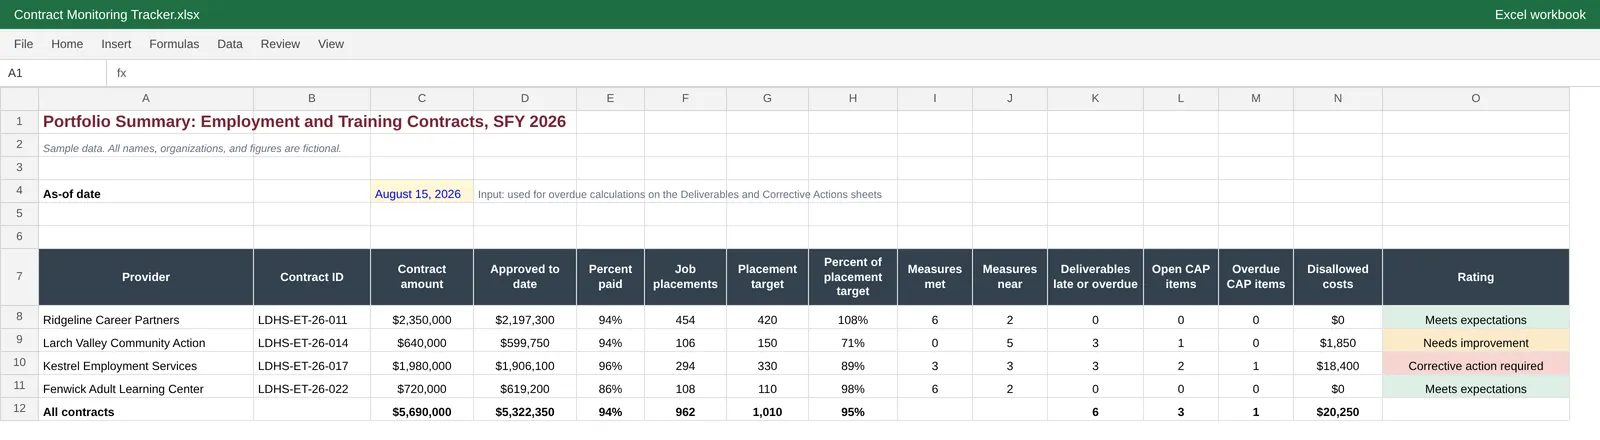
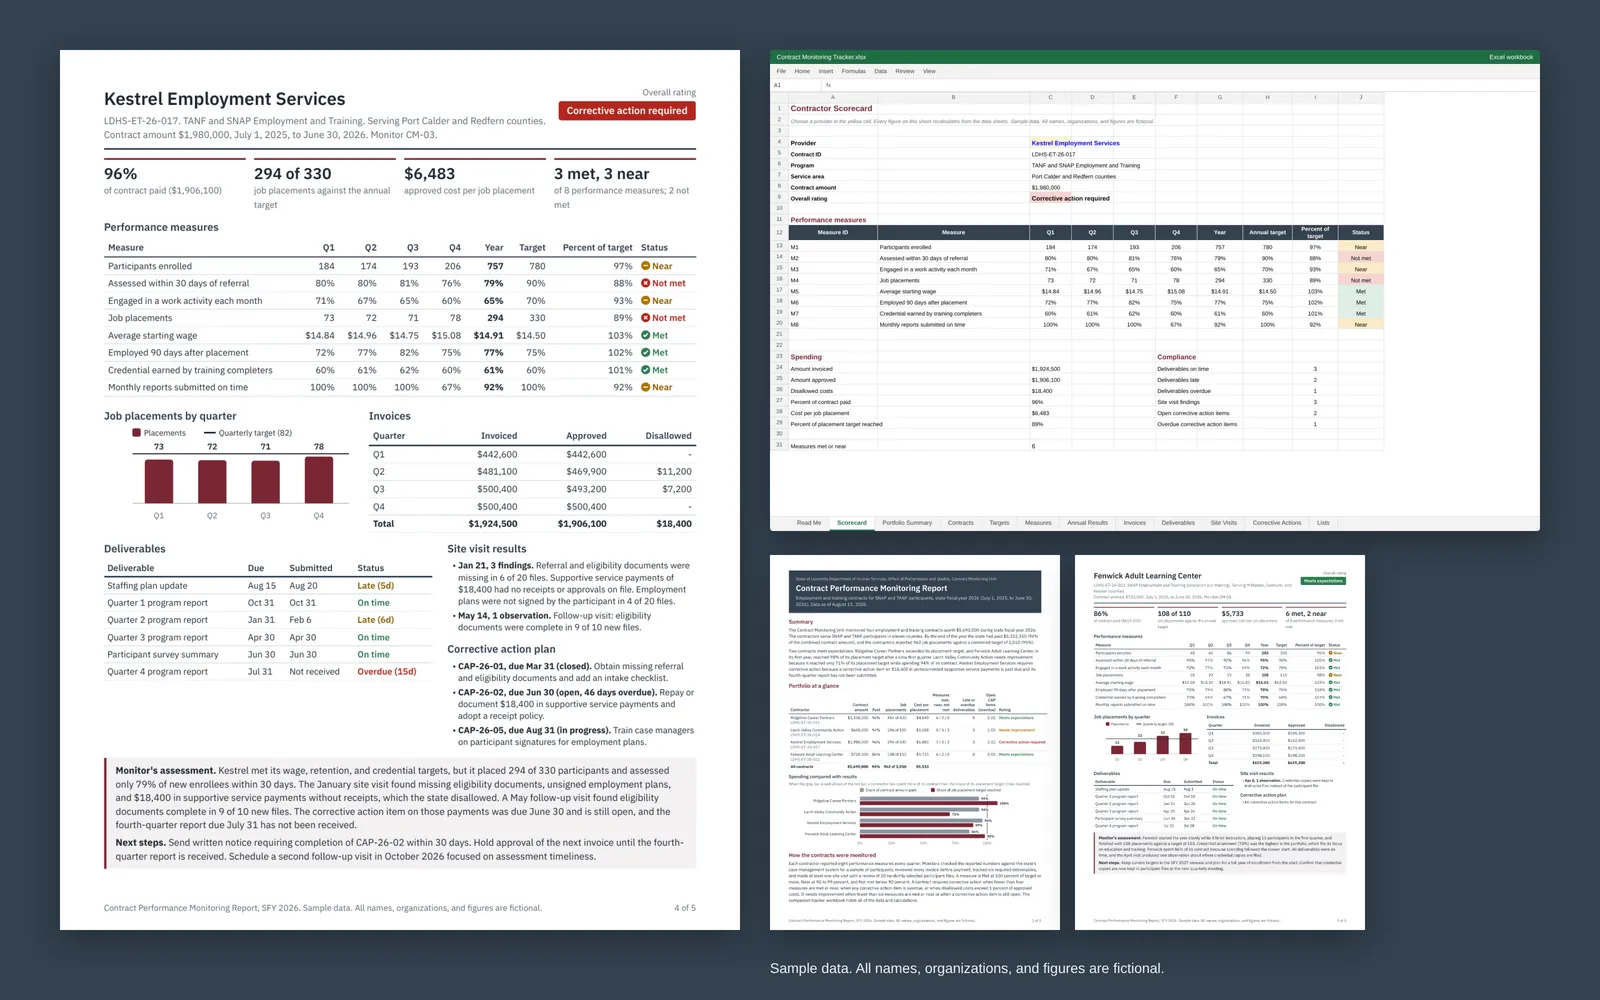
This Excel tracker and 5-page report monitor four fictional employment and training contracts that serve SNAP and TANF participants. Together they tie spending to results and rate each contractor on performance, deliverables, site visit findings, and corrective action status.

Sample data. All names, organizations, and figures are fictional.

Contract Performance Monitoring Report: OverviewOpen larger image

About this sample

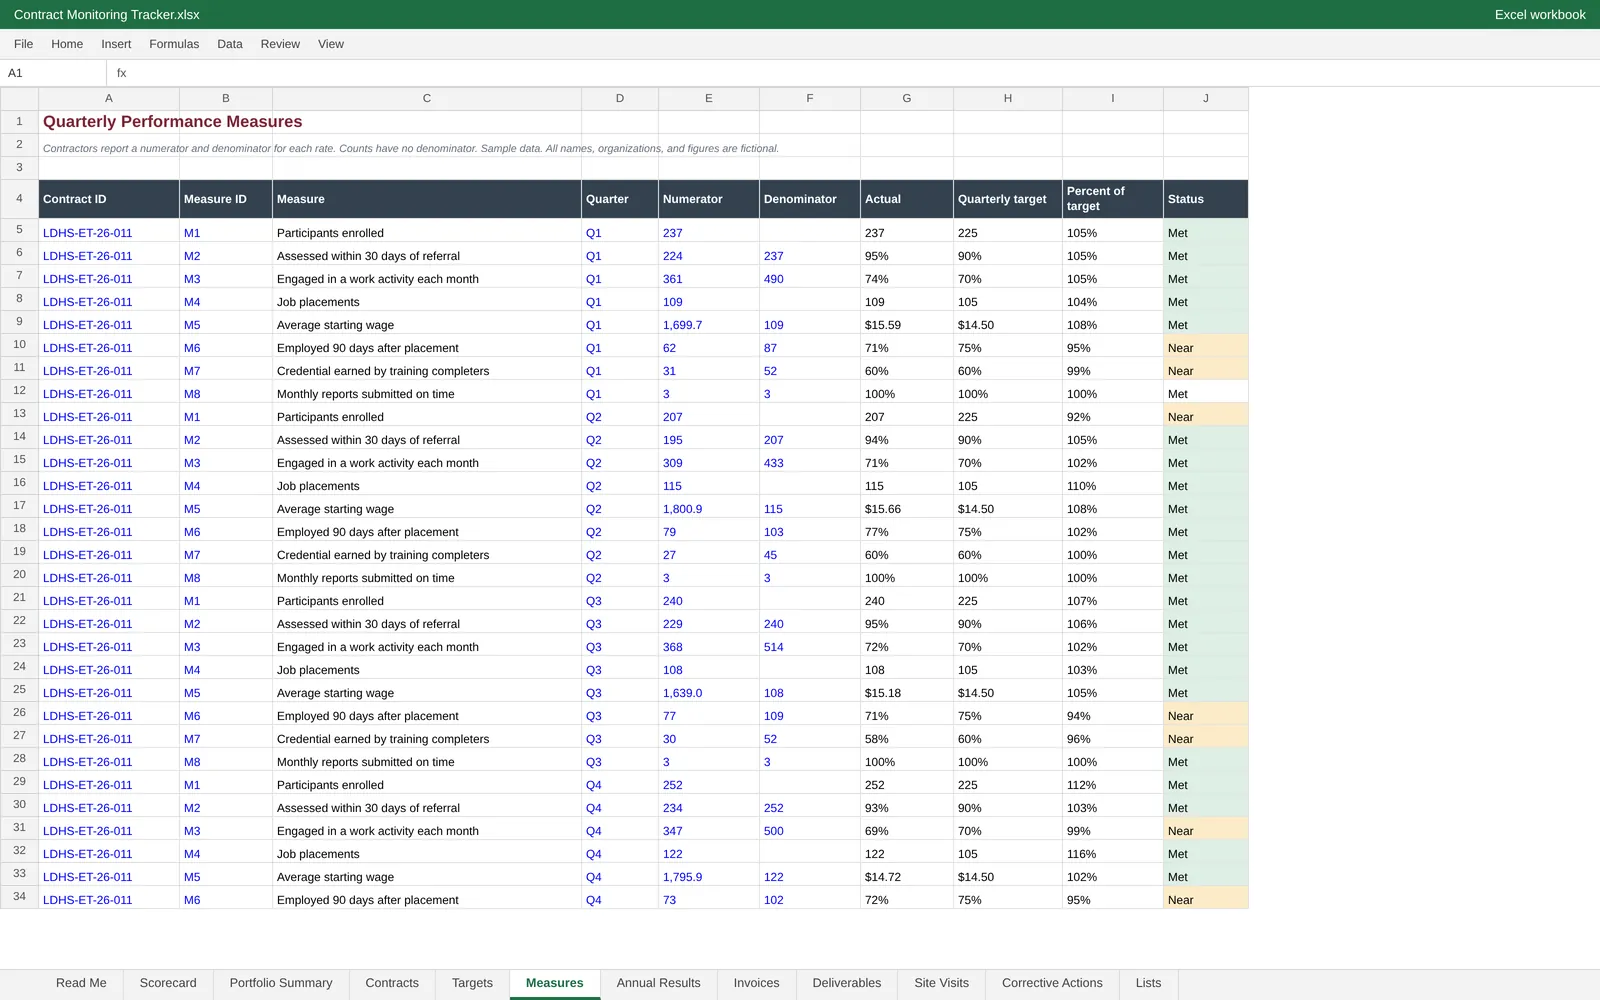
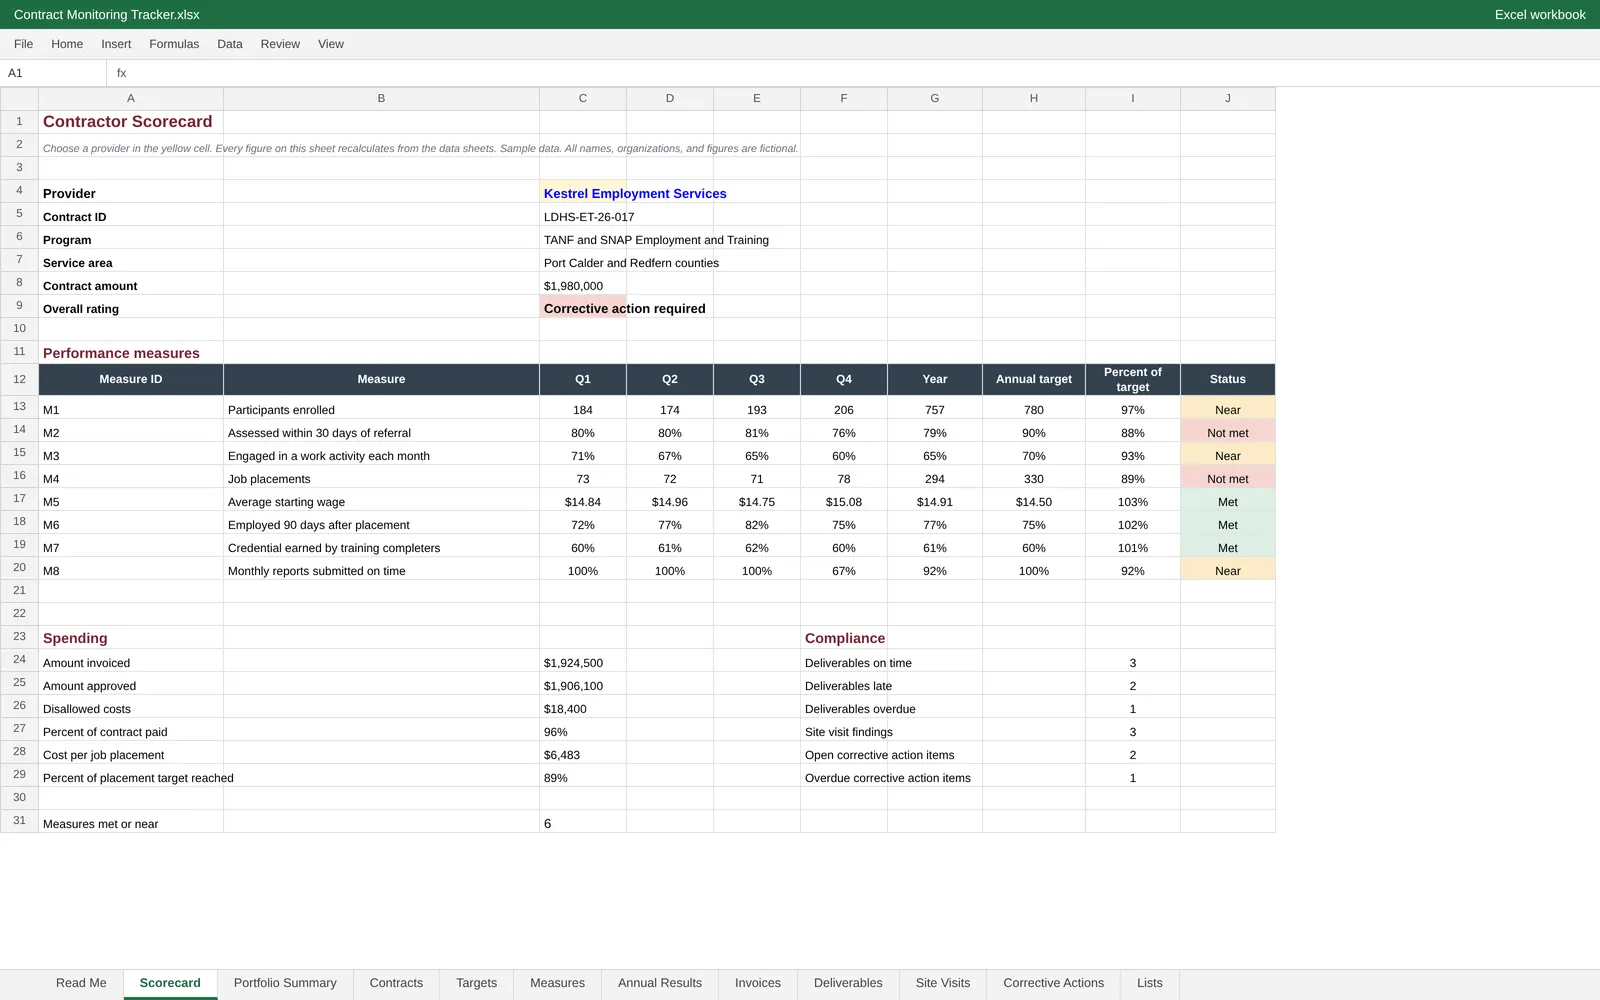
The tracker holds the contract register, annual targets, quarterly performance measures reported as numerators and denominators, invoices with disallowed costs, deliverables with due and submitted dates, site visit findings, and corrective action items. Formulas calculate status against targets, days late and overdue from an as-of date, and an overall rating using a written rule. A scorecard sheet with a provider drop-down and a portfolio summary sheet pull it all together, with charts.

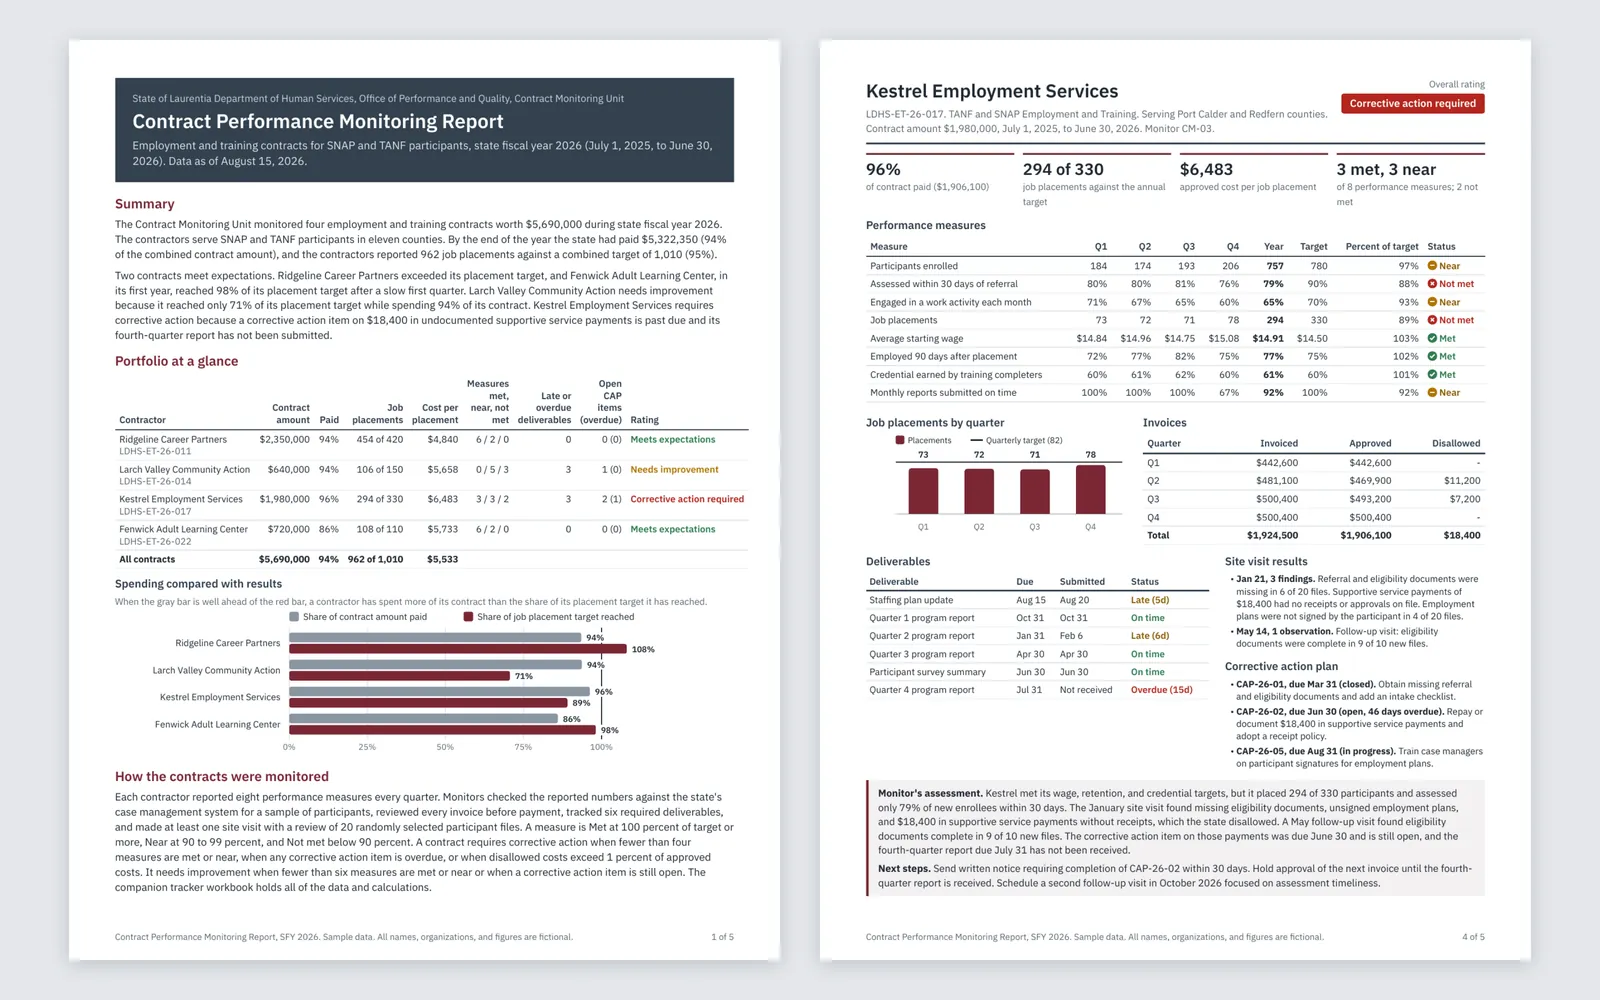
The report opens with a portfolio summary and a chart of spending compared with results, then gives each contractor a one-page scorecard with quarterly measures, invoices, deliverables, site visit results, corrective action status, and the monitor's assessment and next steps. It is the kind of product a state contract monitoring unit gives program leadership before renewal decisions.
What it includes

  • Quarterly performance measures against targets with Met, Near, and Not met status
  • Invoices compared with results, including cost per job placement and disallowed costs
  • Deliverables tracking with days late calculated from an as-of date
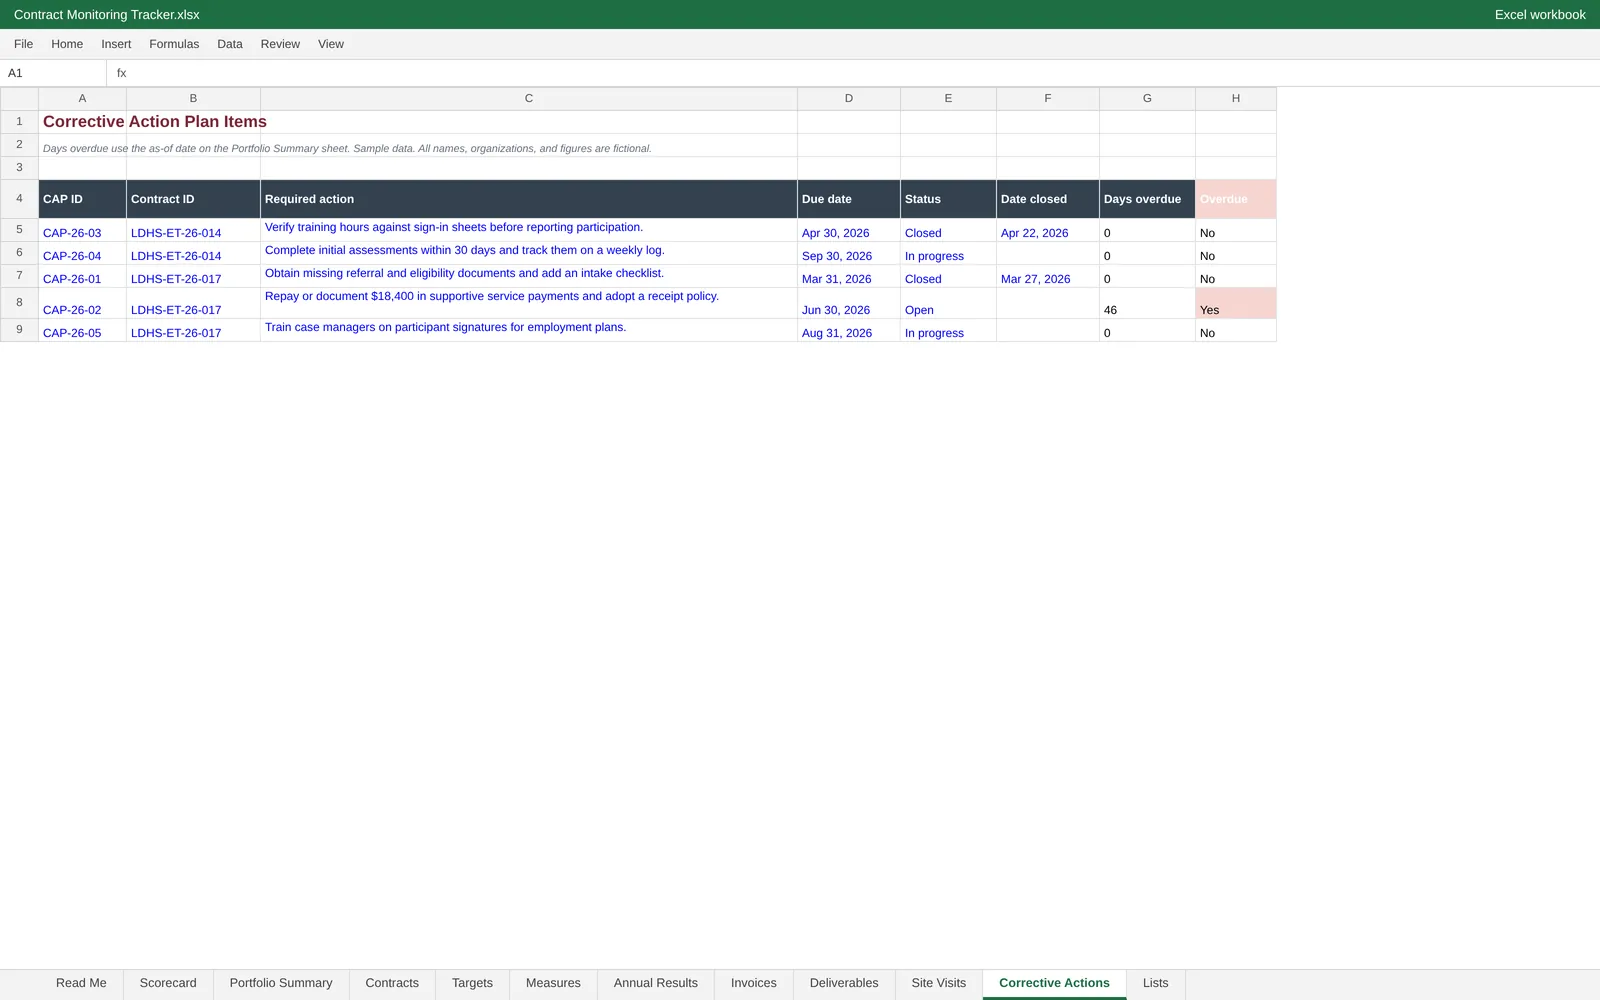
  • Site visit findings and corrective action items with overdue flags
  • Scorecard sheet that updates for any contractor chosen from a drop-down
  • Rating rule written out and built into formulas
  • 5-page report with a portfolio summary and one scorecard page per contractor

Screenshots

Select an image to see it larger.

More in Public Sector and Human Services

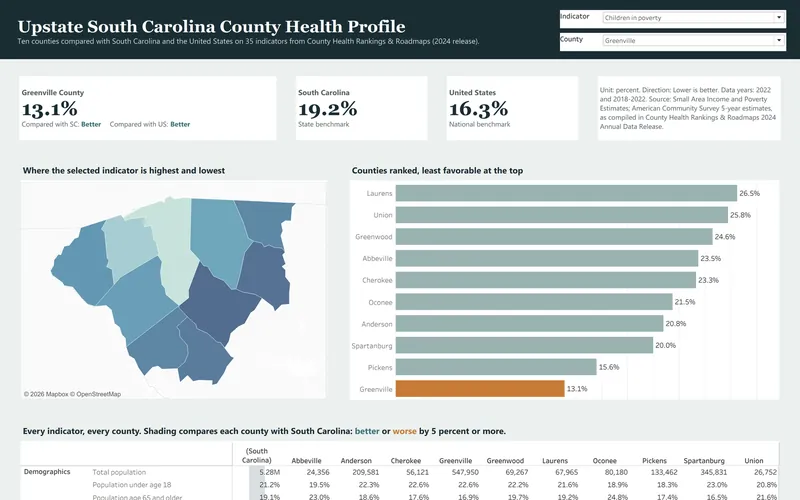
County Health Profile: Upstate South Carolina

This is the secondary data profile from a community health needs assessment for ten Upstate South Carolina counties, and it is built from the 2024 County Health Rankings release. It compares 35 county indicators with state and national values and turns them into a dashboard, a 14-page report and an Excel workbook.

  • Excel
  • Tableau
  • PDF report

Public data

Community Health Survey Results

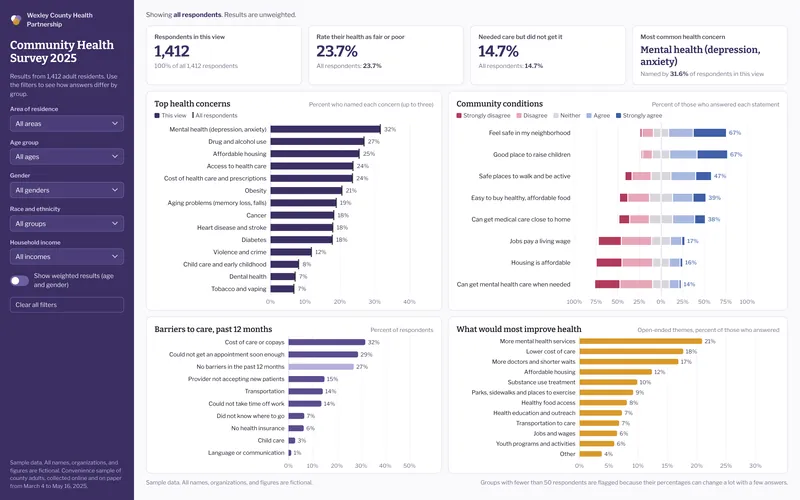
This sample analyzes a fictional county community health survey with 1,412 respondents, which is the kind of survey hospitals run as part of a community health needs assessment. It includes a filterable dashboard, an 8-page results brief and an Excel workbook with crosstabs, a codebook and weighting.

  • Excel
  • Power BI
  • PDF report

Sample data