Public Sector and Human Services

Child Welfare Outcomes Dashboard

This five-page dashboard tracks the seven federal CFSR Round 4 statewide data indicators for a fictional state with 30 counties over five federal fiscal years. It compares the state with national performance the way the federal data profiles do and shows where counties differ from the state.

Sample data. All names, organizations, and figures are fictional. Indicator definitions and national performance values: Source: U.S. Department of Health and Human Services, Administration for Children and Families, Children's Bureau, CFSR Technical Bulletin #13A (Amended), 2022.

Child Welfare Outcomes Dashboard: Tableau dashboardOpen larger image

About this sample

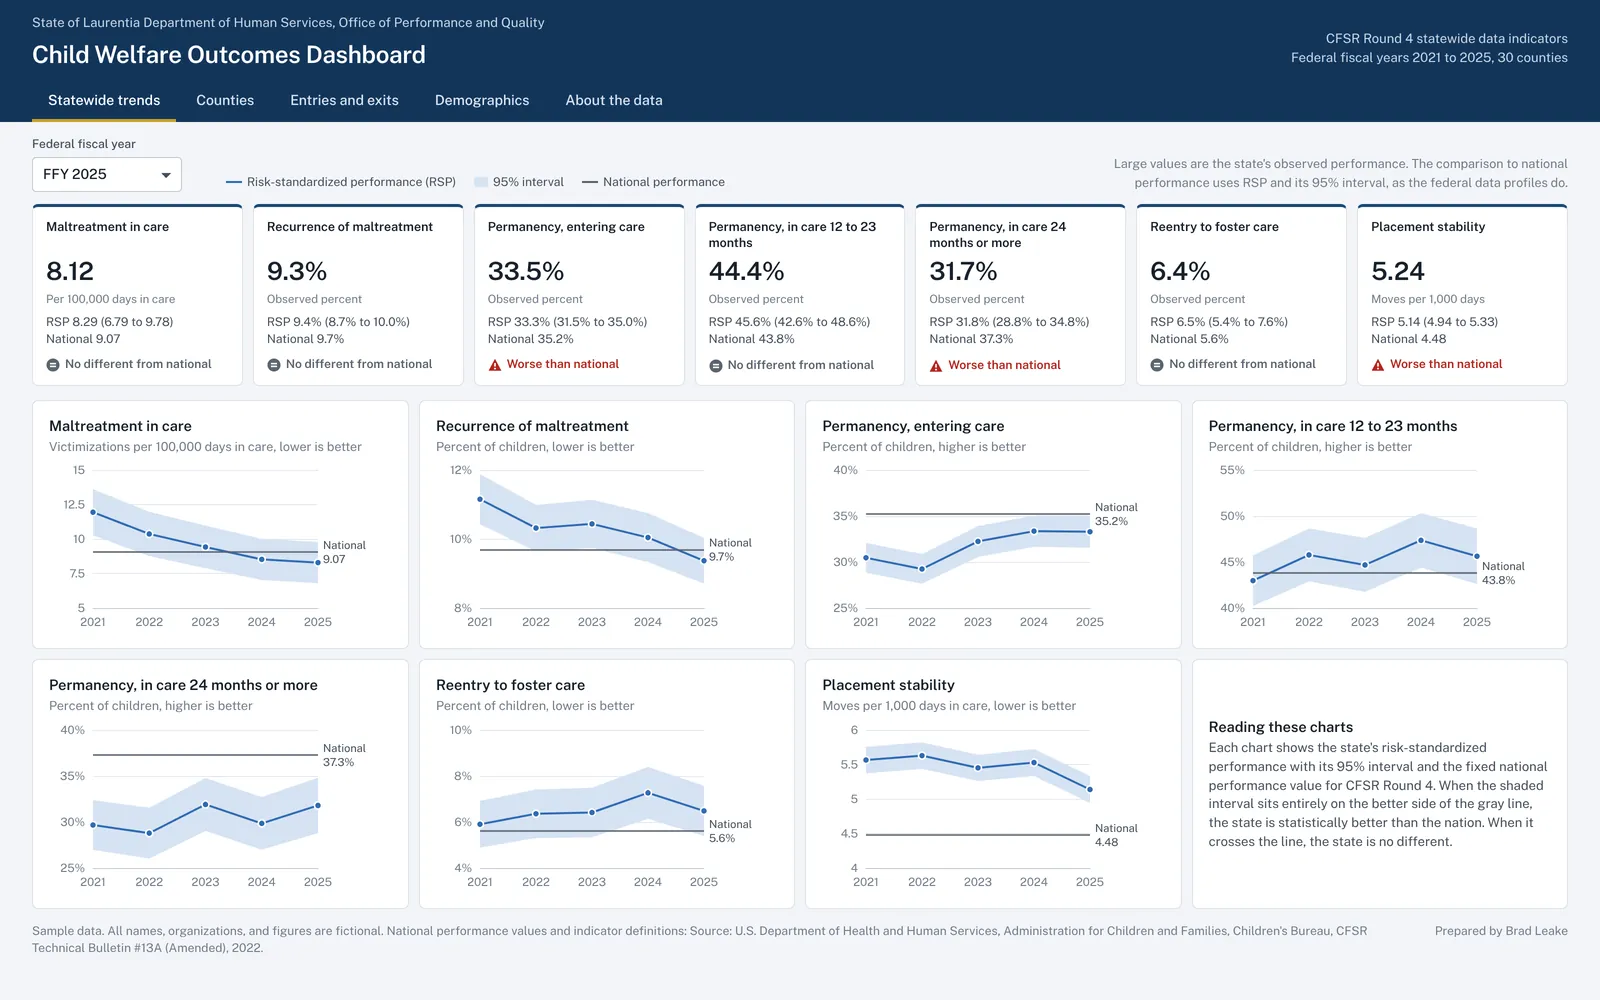
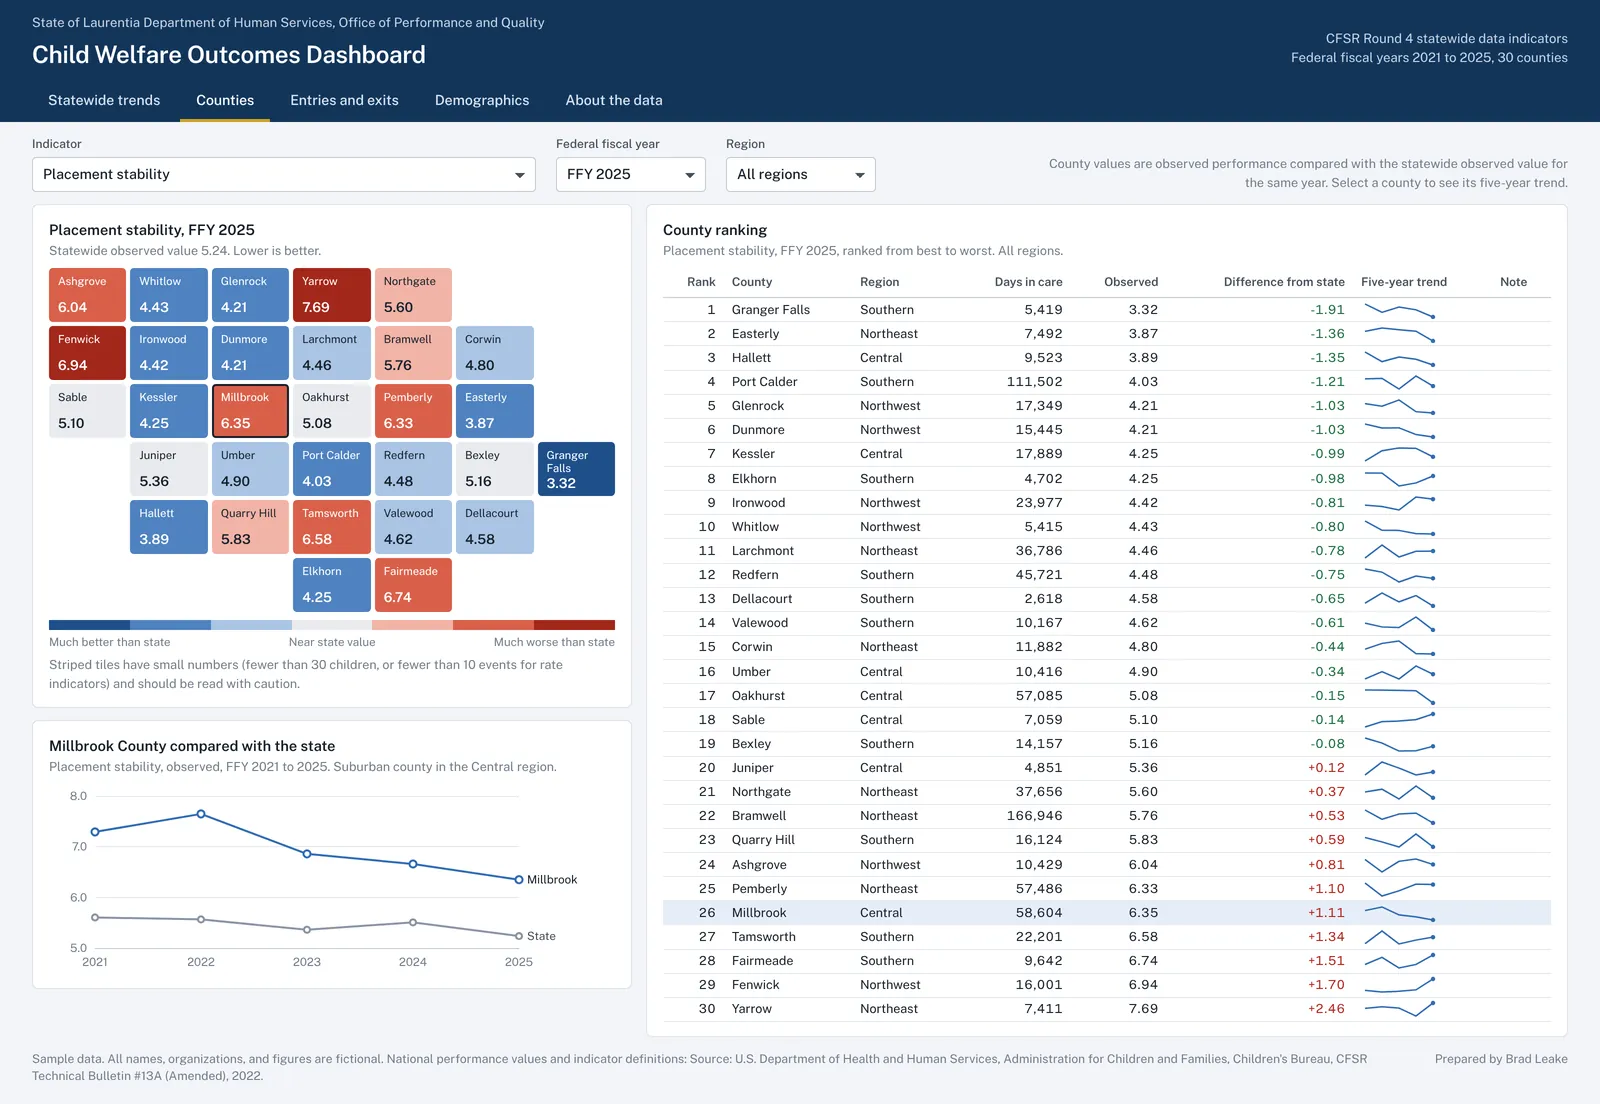
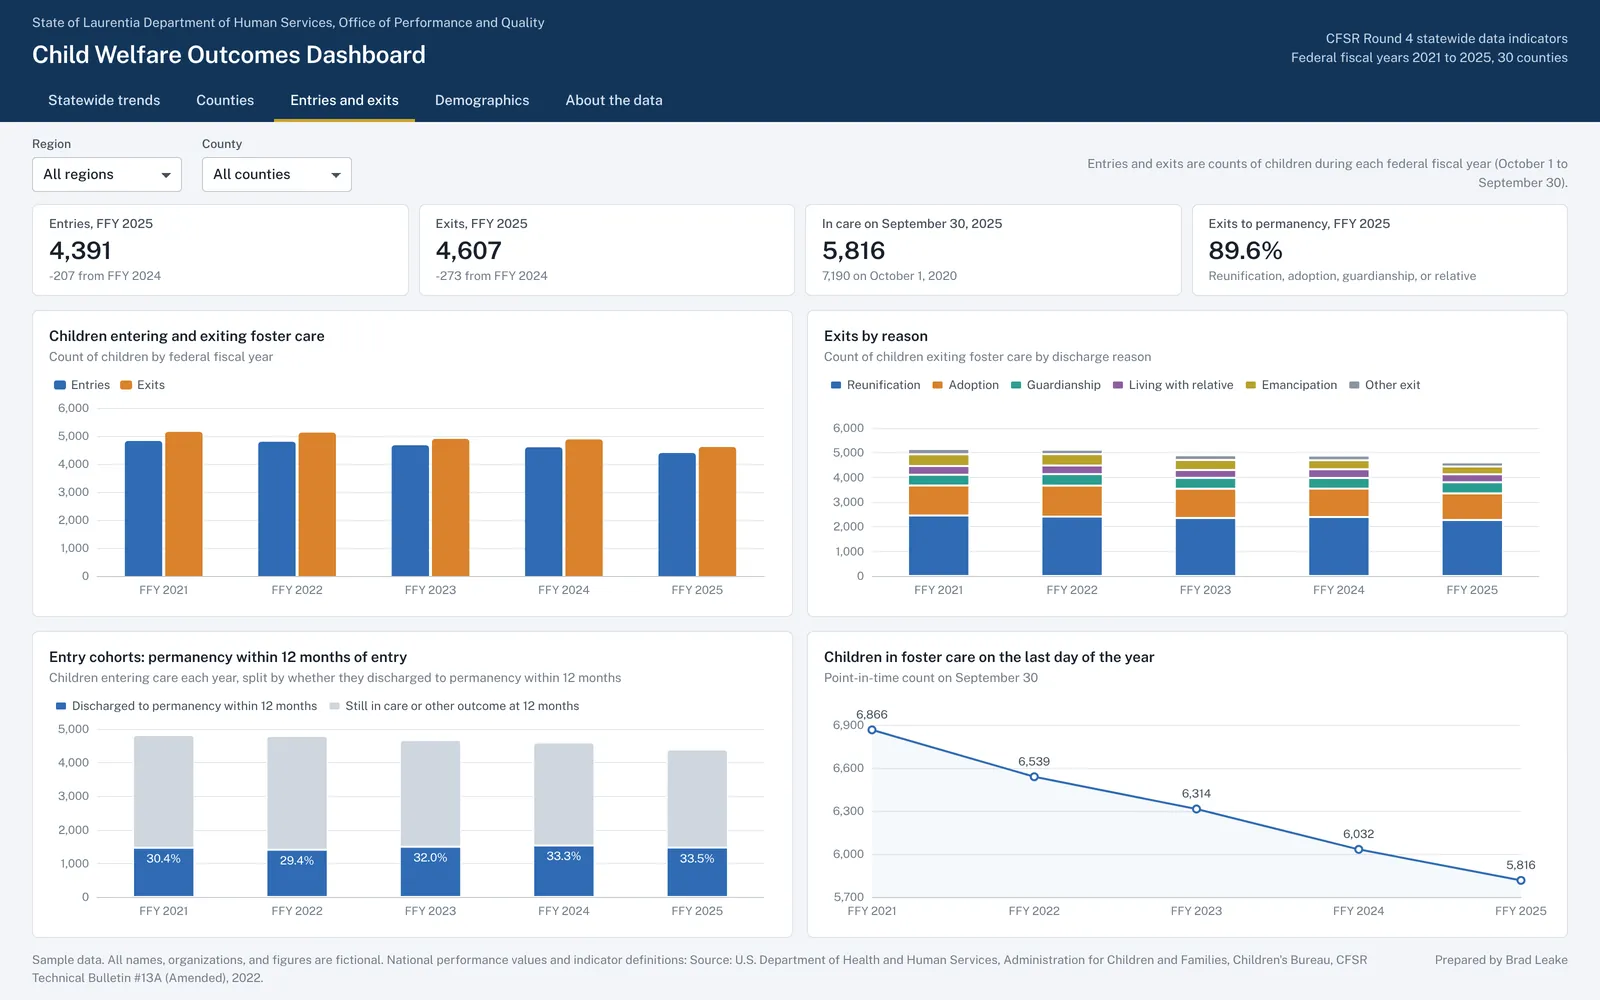
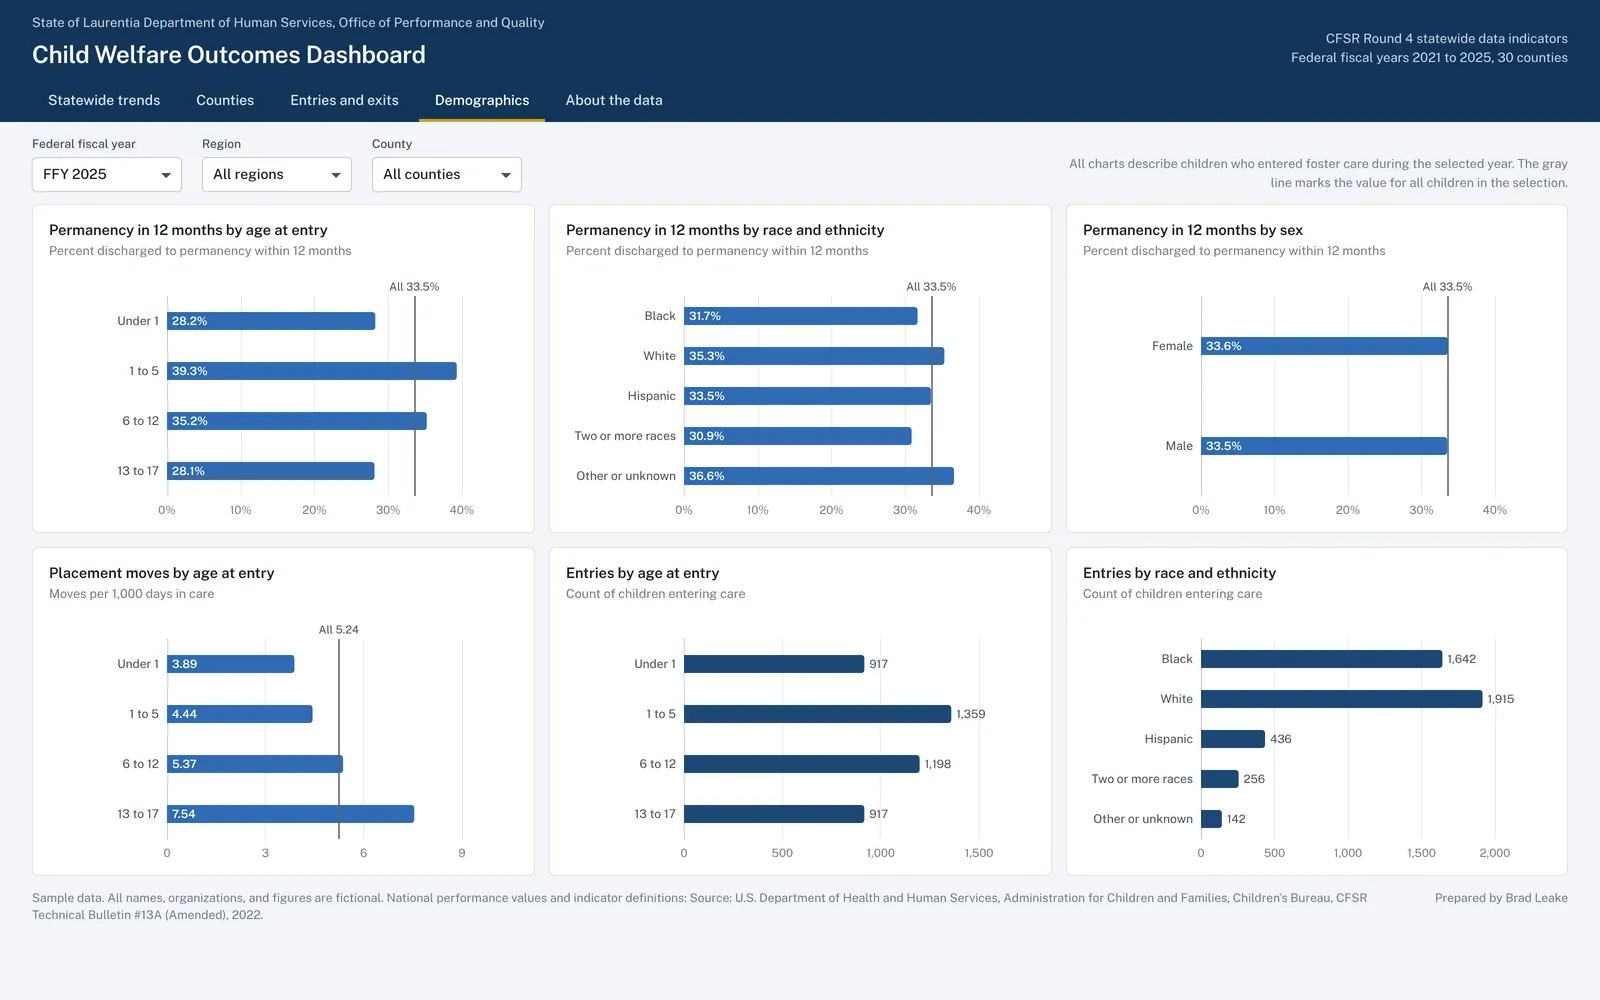
The dashboard is built for a state child welfare agency's leadership and quality assurance staff. The statewide page shows each indicator's risk-standardized performance and 95 percent interval against the fixed national performance value, with a plain label for better, no different, or worse. The county page has a tile map and a ranking table with small-number flags and a click-through county trend, and the other pages cover entries and exits, entry cohort outcomes, and breakouts by age, race and ethnicity, and sex.

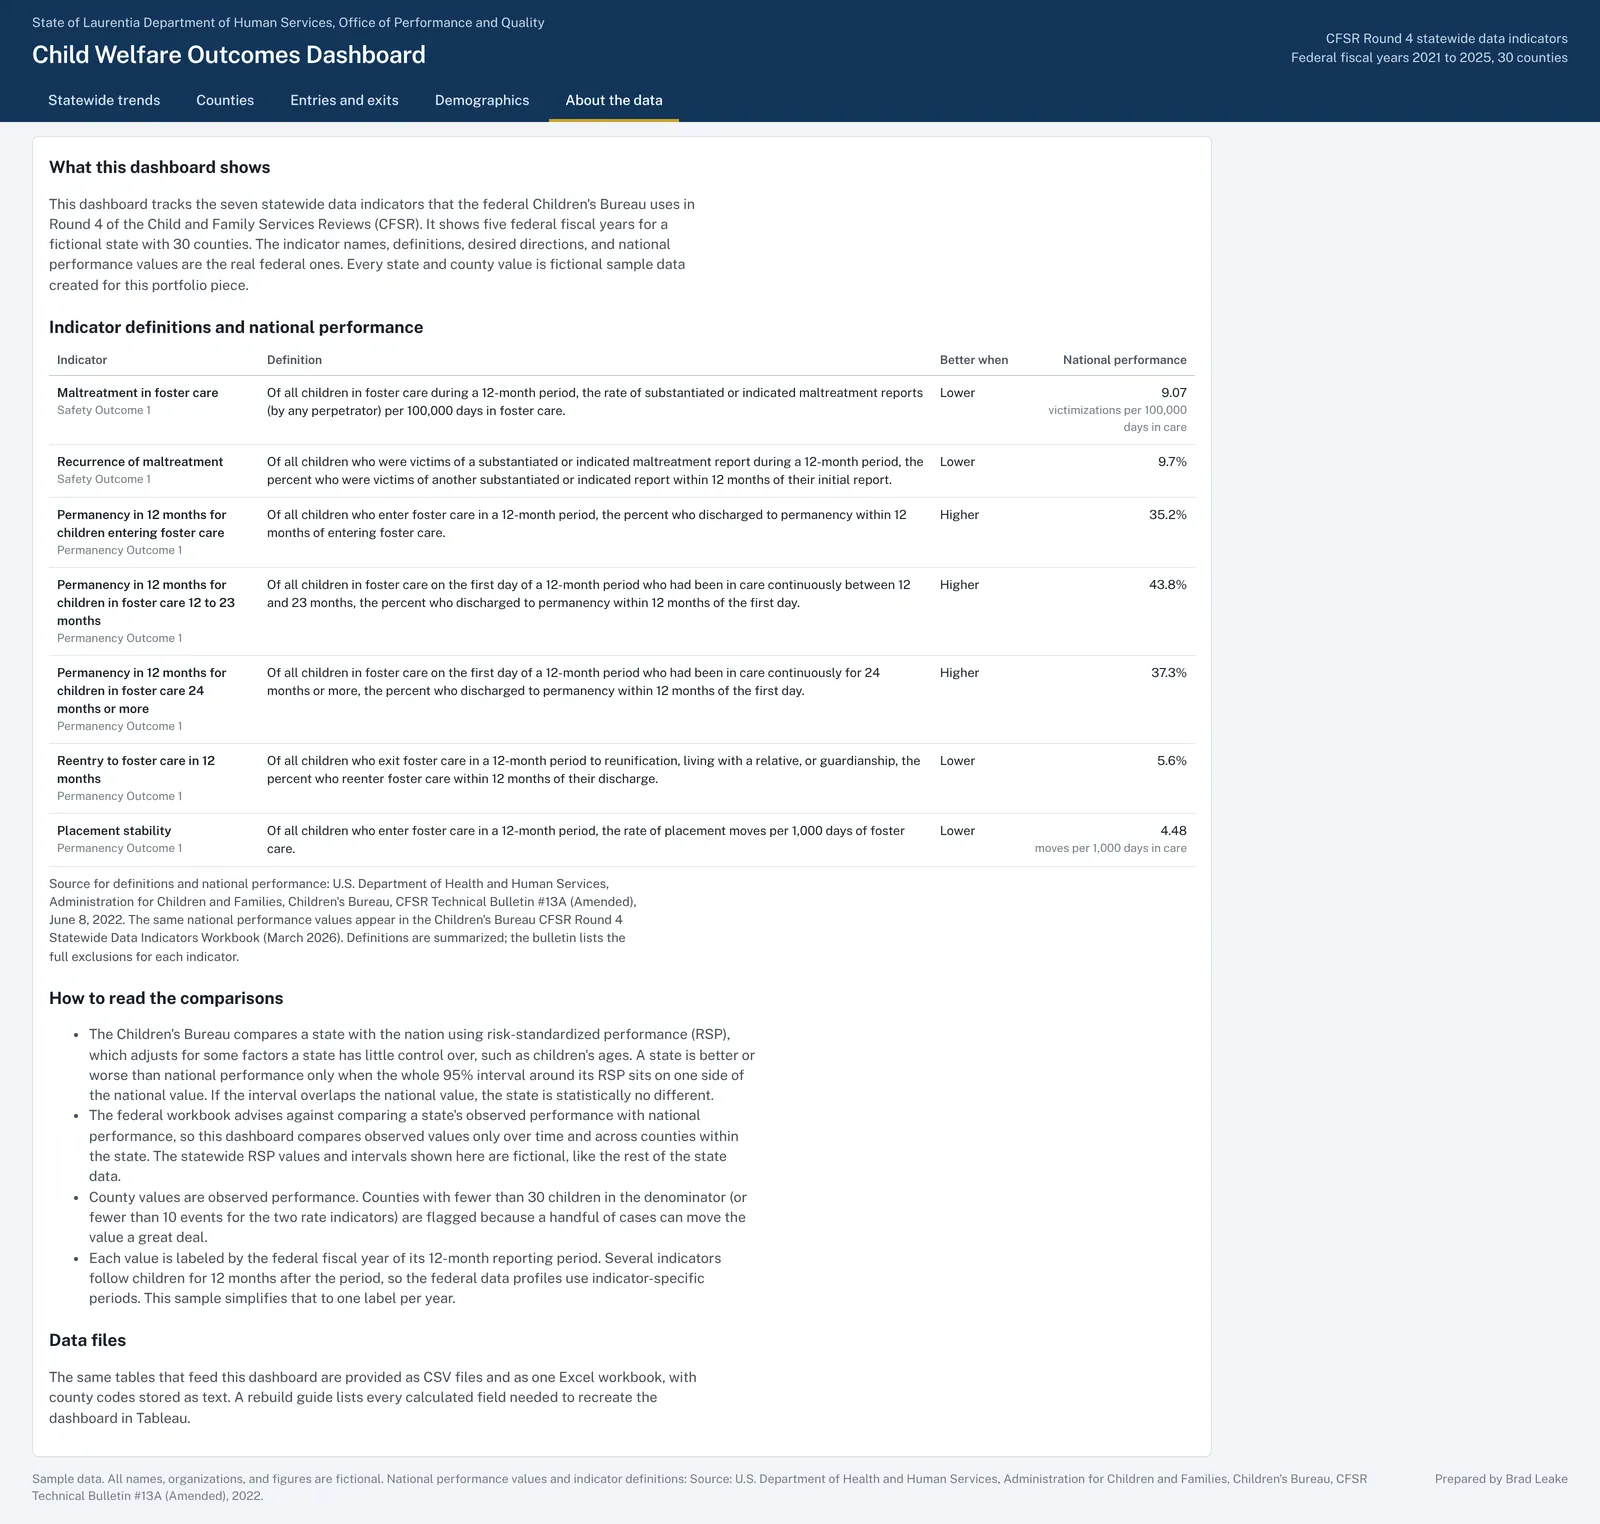
The indicator definitions and national performance values are the real federal ones from CFSR Technical Bulletin #13A, cited on the dashboard. Every state and county value is fictional. The package includes the data tables as CSV files and one Excel workbook with text county codes, plus a Tableau rebuild guide with every calculated field, the page layouts, and a color palette file. The Tableau workbook is included as a packaged file that opens in Tableau Public or Tableau Desktop.

What it includes

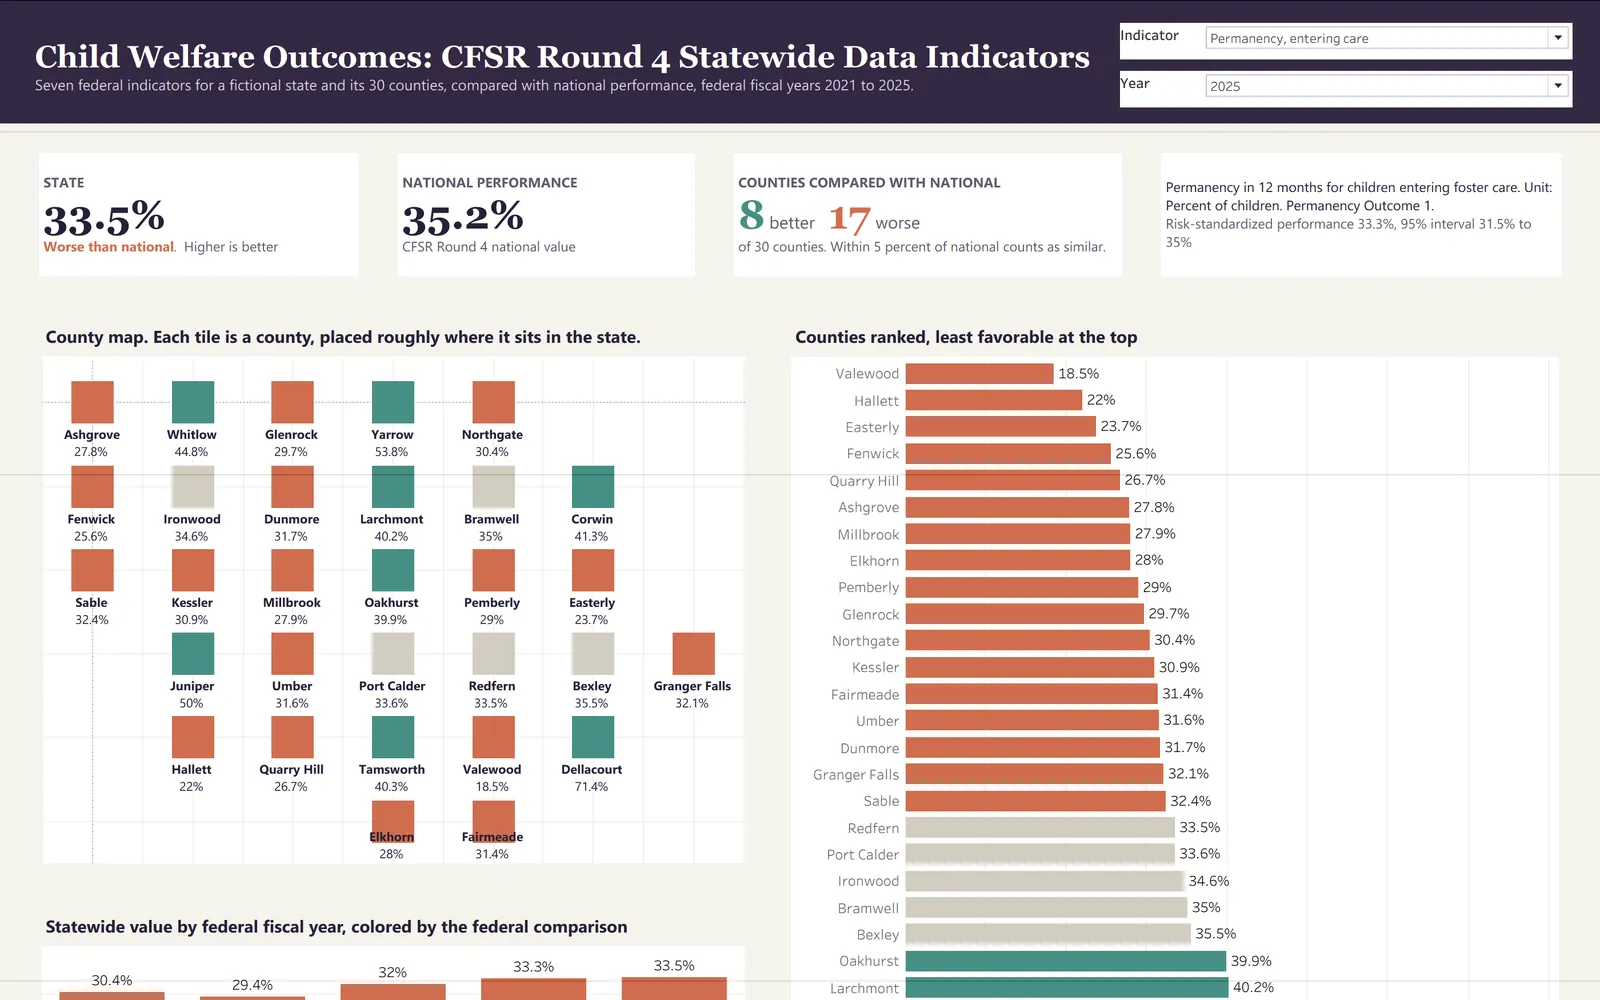
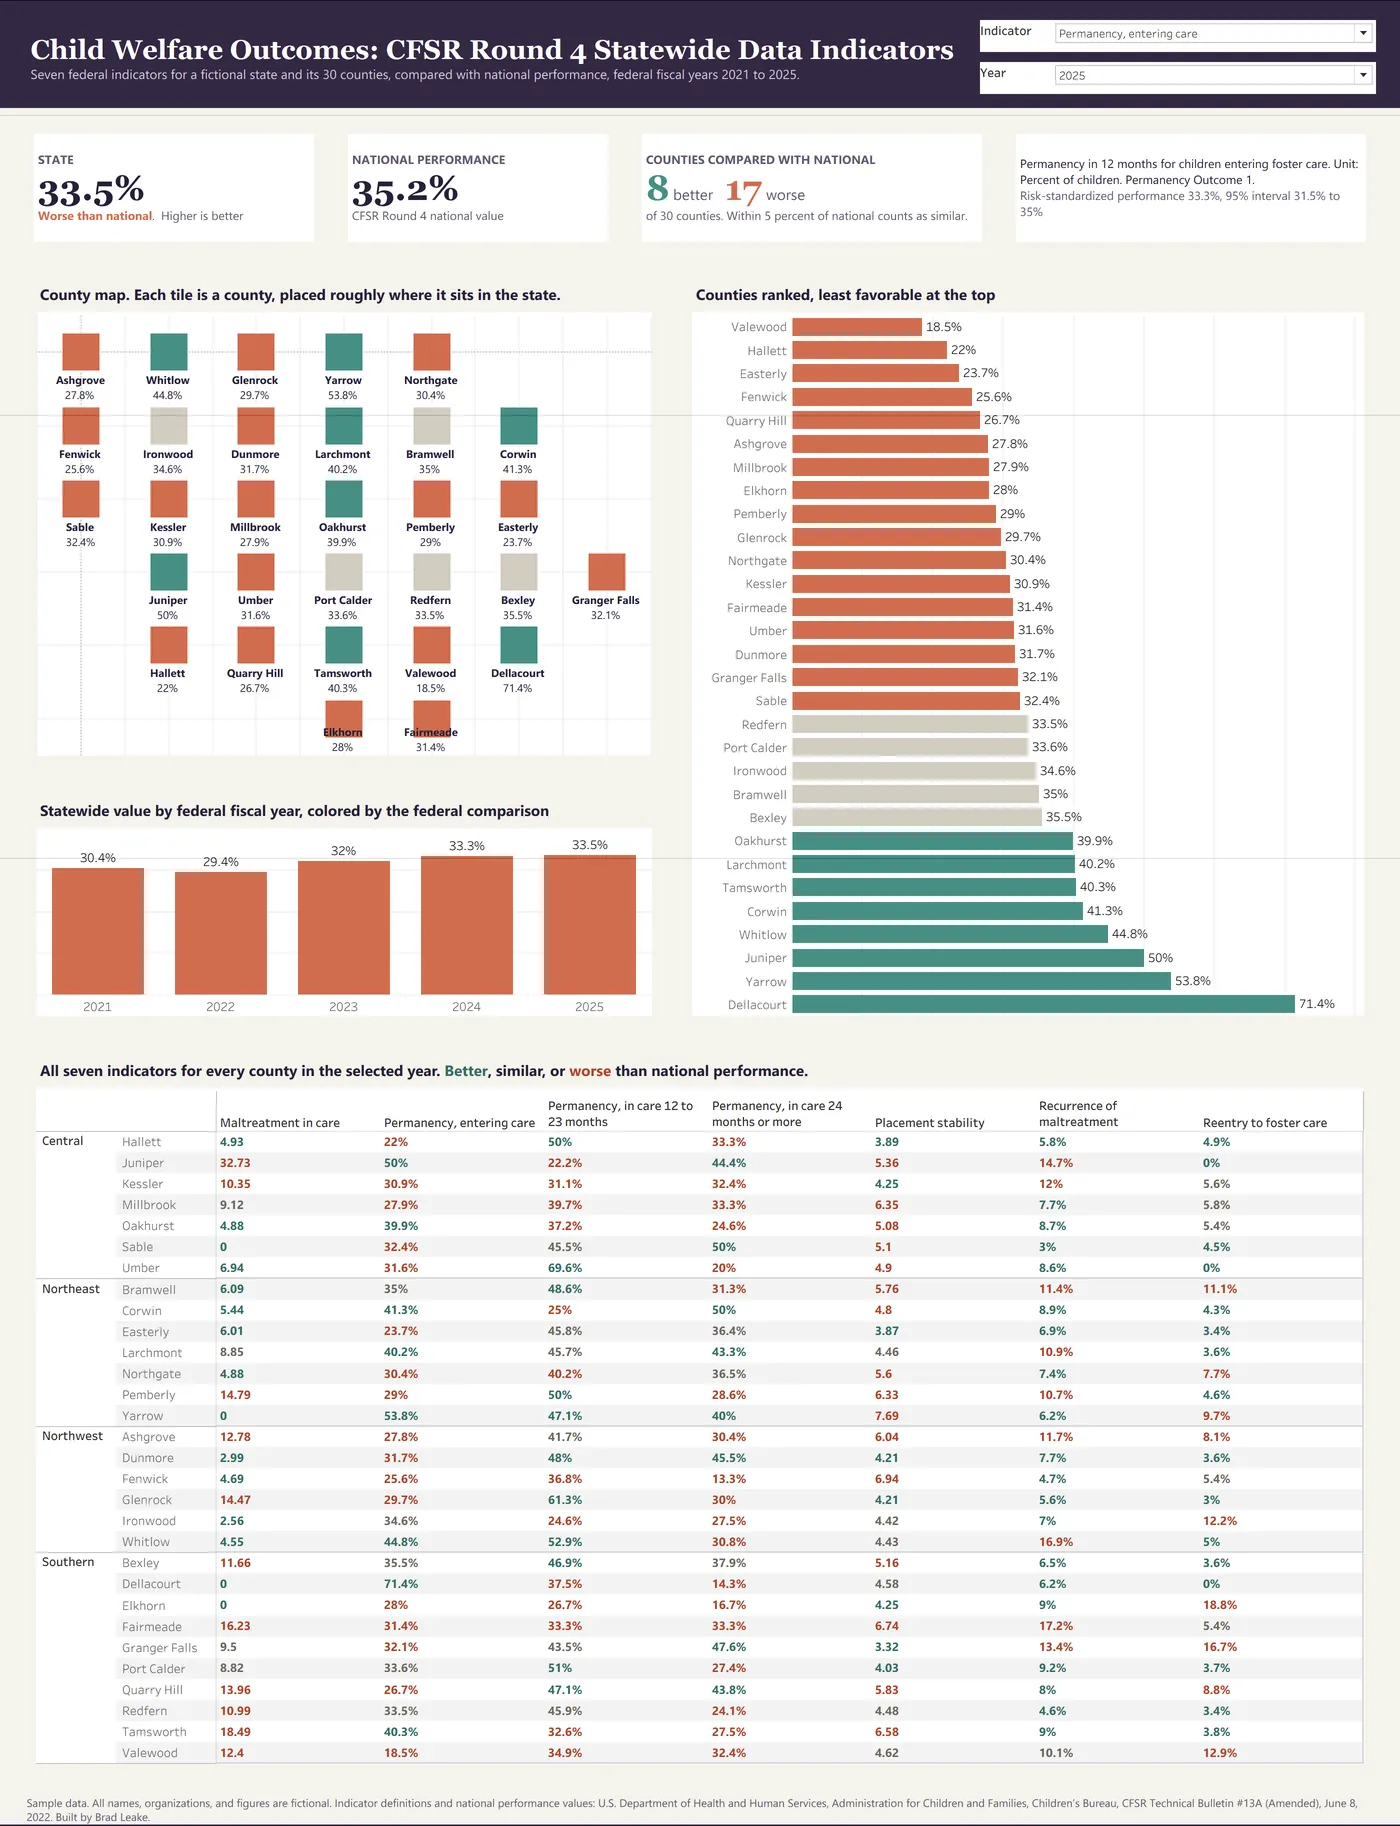
  • Tableau workbook with indicator and year selectors, a county tile map, a ranked county chart, the statewide trend, and a matrix of all seven indicators for every county
  • All seven CFSR Round 4 statewide data indicators with the real federal definitions and national performance values
  • Statewide trend charts showing risk-standardized performance and its 95 percent interval against national performance
  • County tile map and ranking table with differences from the state value and small-number flags
  • Entry and exit counts, exits by reason, and entry cohort results
  • Permanency and placement stability broken out by age, race and ethnicity, and sex
  • Clean data tables in CSV and Excel with text county codes
  • Tableau rebuild guide with calculated fields, layout notes, colors, and check totals

Screenshots

Select an image to see it larger.

More in Public Sector and Human Services

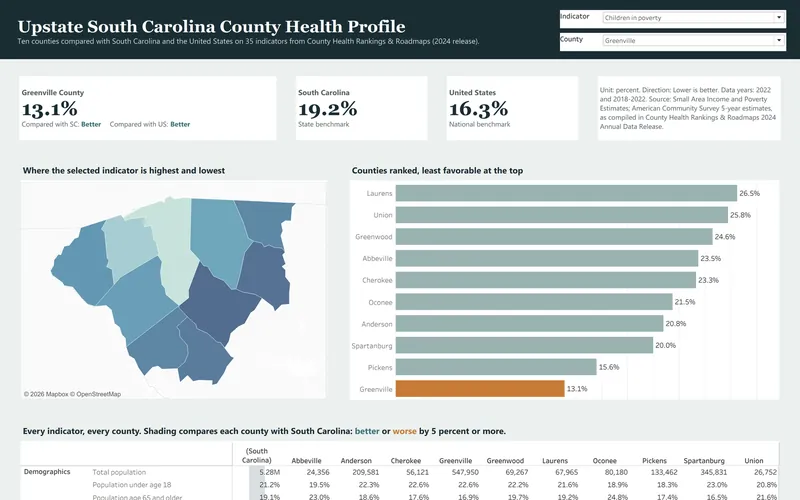
County Health Profile: Upstate South Carolina

This is the secondary data profile from a community health needs assessment for ten Upstate South Carolina counties, and it is built from the 2024 County Health Rankings release. It compares 35 county indicators with state and national values and turns them into a dashboard, a 14-page report and an Excel workbook.

  • Excel
  • Tableau
  • PDF report

Public data

Community Health Survey Results

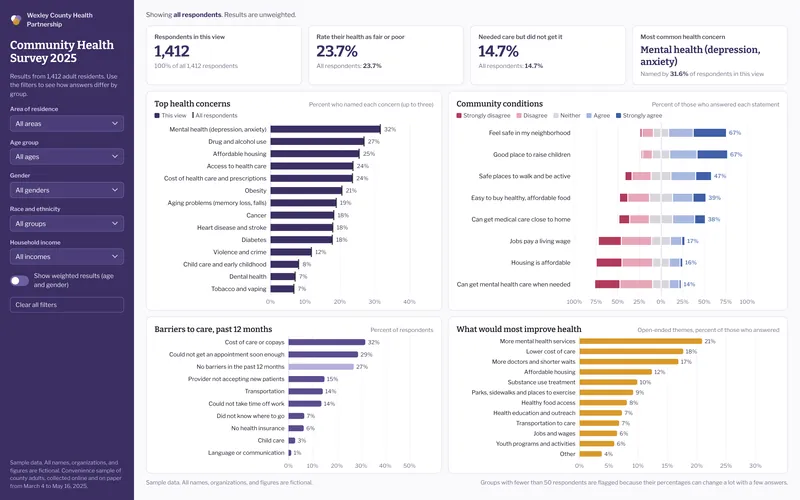
This sample analyzes a fictional county community health survey with 1,412 respondents, which is the kind of survey hospitals run as part of a community health needs assessment. It includes a filterable dashboard, an 8-page results brief and an Excel workbook with crosstabs, a codebook and weighting.

  • Excel
  • Power BI
  • PDF report

Sample data